Finding features
View Sequence overviewStudents will:
- explore the varying external features of animals.
- identify the distinguishing external features by which some animals can be grouped.
- explore the depiction of animal features by Aboriginal and Torres Strait Islander Peoples.
Students will represent their understanding as they:
- share their ideas for comparisons of animals and their features during group discussions.
- contribute to a class ideas map about animal features.
In this lesson, assessment is formative.
Feedback might focus on:
- Are students able to recognise the basic vocabulary of animal features?
- Are students able to group animals according to more obvious features (horns, tails, fins etc.)
- Did students identify multiple ways to group the same animals?
Whole class
Class science journal (digital or hard-copy)
Optional: Seeds planted in lesson 2
Demonstration copy of Who am I? Resource sheet
Images of art created by Aboriginal and Torres Strait Islander Peoples. Trusted sources include:
- Aboriginal artwork in the Kimberley could be among oldest in the world, scientists say (ABC)
- Animals in Aboriginal Art - The Turtle (Mbantua Gallery)
- Old Masters: Australia’s Great Bark Artists (National Museum of Australia)
Australian coins which depict native animals for coin rubbings
Individual animal cards created using the Animal cards Resource sheet, laminated to support reuse
Each group
Who am I? Resource sheet
Lesson
The Inquire phase allows students to cycle progressively and with increasing complexity through the key science ideas related to the core concepts. Each Inquire cycle is divided into three teaching and learning routines that allow students to systematically build their knowledge and skills in science and incorporate this into their current understanding of the world.
When designing a teaching sequence, it is important to consider the knowledge and skills that students will need in the final Act phase. Consider what the students already know and identify the steps that need to be taken to reach the level required. How could you facilitate students’ understanding at each step? What investigations could be designed to build the skills at each step?
Read more about using the LIA FrameworkRe-orient
If you are still observing the growth of students' planted seeds, add to the 'How seeds grow - Observation recording table' in the class science journal, drawing a diagram showing the changes that have occurred to the seed/plant, or adding a photograph. Add labels that show any visible growth that has occurred.
If concluding the seed growth observation today, write a final observation explaining the growth of the red kidney bean.
For example: “We observed a red kidney bean grow into a small plant. First the bean grew one small white root. It then continued to grow more roots downwards, as well as a light green stem upwards. Lastly it grew new green leaves.”
Optional: Students might draw and write their own observations in their individual science journals if appropriate.
Refer to the ‘What do we want to learn about plants and animals?’ page in the class science journal.
Remind students that in the previous lessons they looked at the features of plants, and revise some of the specific parts of plants that students have identified, such as seeds, leaves, fruits, roots etc.
Explain to students that they will now look more closely at the features of animals. Highlight this by focusing on the questions students have asked about animals.
The Inquire phase allows students to cycle progressively and with increasing complexity through the key science ideas related to the core concepts. Each Inquire cycle is divided into three teaching and learning routines that allow students to systematically build their knowledge and skills in science and incorporate this into their current understanding of the world.
When designing a teaching sequence, it is important to consider the knowledge and skills that students will need in the final Act phase. Consider what the students already know and identify the steps that need to be taken to reach the level required. How could you facilitate students’ understanding at each step? What investigations could be designed to build the skills at each step?
Read more about using the LIA FrameworkIdentifying and constructing questions is the creative driver of the inquiry process. It allows students to explore what they know and how they know it. During the Inquire phase of the LIA Framework, the Question routine allows for past activities to be reviewed and to set the scene for the investigation that students will undertake. The use of effective questioning techniques can influence students’ view and interpretation of upcoming content, open them to exploration and link to their current interests and science capital.
When designing a teaching sequence, it is important to spend some time considering the mindset of students at the start of each Inquire phase. What do you want students to be thinking about, what do they already know and what is the best way for them to approach the task? What might tap into their curiosity?
Read more about using the LIA FrameworkWho am I?
Pose the question: What parts/features can you observe on animals?
Identify the parts of animals that students know by discussing any recent animal encounters students have had, including through media.
- Have you seen any animals in real life recently? Or on a TV show?
- Can you name the animal?
- How would you describe your animal? What features did you see?
Referring to the Who am I? Resource sheet, students talk with a partner and identify as many of the features they can see, and (if they can) the animals each features belong to:
- snake: skin/scales
- bull: horns, hair/fur
- cat: eyes, ears, fur
- frog: feet, toes/digits
- butterfly: wing, patterns
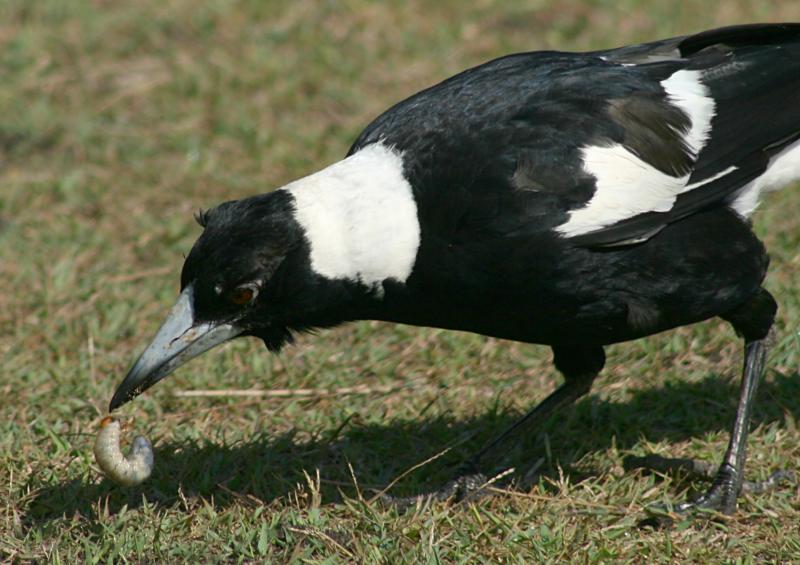
- magpie/bird: beak, eye
- rabbit: ears, fur
- penguin: webbed feet/flippers, wings, feathers
Key features of animals
What are the key features of animals, and the purpose of these features?
All animals are able to move themselves from place to place at least during one stage of their lives. For example, the larvae of oysters swim before the animal fixes itself on to a hard surface. This capacity for independent movement is a key difference from plants and has resulted in a wide array of features to accommodate different types of movement, such as fins for gliding through water, legs to walk or to jump and wings to fly or glide.
Animals also differ from plants in that they need to eat other living things in order to survive. This means animals have a range of features to help them locate, catch and eat food. Bats have well developed ears to help them locate prey using sound (echolocation), dogs have noses that can pick up an amazing array of scents and some snakes have special organs (pit organs) to help them sense a prey’s body heat.
There is usually a strong link between the form and function of specific features. For example, the shape and size of an animal’s teeth relates to the type of food the animal eats: herbivores have large molars to help grind down cellulose fibres in plants and carnivores have sharp canines to rip flesh. Different honeyeaters and finches have different-shaped beaks depending on the types of flowers and insects they rely on for food. Predators often have a pair of eyes on the front of their head for accurate vision and depth perception for hunting, whereas the eyes of prey are usually on the sides of the head, providing a large field of view to help detect predators and then flee in the opposite direction.
There are other external features used by predators and prey for attack or defence, such as spines and spikes. Hair, fur and feathers are another group of external features that enable animals to cope in harsh environments and prevent heat loss. In some cases, these features are also used for communication, such as birds’ brightly coloured feathers, or the moving patterns on a chameleon’s scales.
Alternative conceptions
What alternative conceptions might students hold about animals?

Many students have non-scientific ideas about what an animal is. Many students’ concept of an animal is limited to common mammals such as cats, dogs and cows, and does not include humans or insects. This highlights the importance of explicitly teaching students that humans are animals and highlighting the features that we have in common with many, such as legs for walking, teeth for chewing, fine hair on our skin to help keep us warm.
Students commonly hold anthropomorphic views of animals—that is, they attribute human motivation, features or behaviour to animals. These views are often perpetuated in storybooks and films.
The Inquire phase allows students to cycle progressively and with increasing complexity through the key science ideas related to the core concepts. Each Inquire cycle is divided into three teaching and learning routines that allow students to systematically build their knowledge and skills in science and incorporate this into their current understanding of the world.
When designing a teaching sequence, it is important to consider the knowledge and skills that students will need in the final Act phase. Consider what the students already know and identify the steps that need to be taken to reach the level required. How could you facilitate students’ understanding at each step? What investigations could be designed to build the skills at each step?
Read more about using the LIA FrameworkThe Investigate routine provides students with an opportunity to explore the key ideas of science, to plan and conduct an investigation, and to gather and record data. The investigations are designed to systematically develop content knowledge and skills through increasingly complex processes of structured inquiry, guided inquiry and open inquiry approaches. Students are encouraged to process data to identify trends and patterns and link them to the real-world context of the teaching sequence.
When designing a teaching sequence, consider the diagnostic assessment (Launch phase) that identified the alternative conceptions that students held. Are there activities that challenge these ideas and provide openings for discussion? What content knowledge and skills do students need to be able to complete the final (Act phase) task? How could you systematically build these through the investigation routines? Are there opportunities to build students’ understanding and skills in the science inquiry processes through the successive investigations?
Read more about using the LIA FrameworkAustralia’s unique animals
Discuss Australian native animals, asking students to identify any if possible.
- Do you know the names of any animals that are 'special'/native to Australia?
- Use language that is suitable to your students here, re-wording the question as required to frame it in a way they will understand.
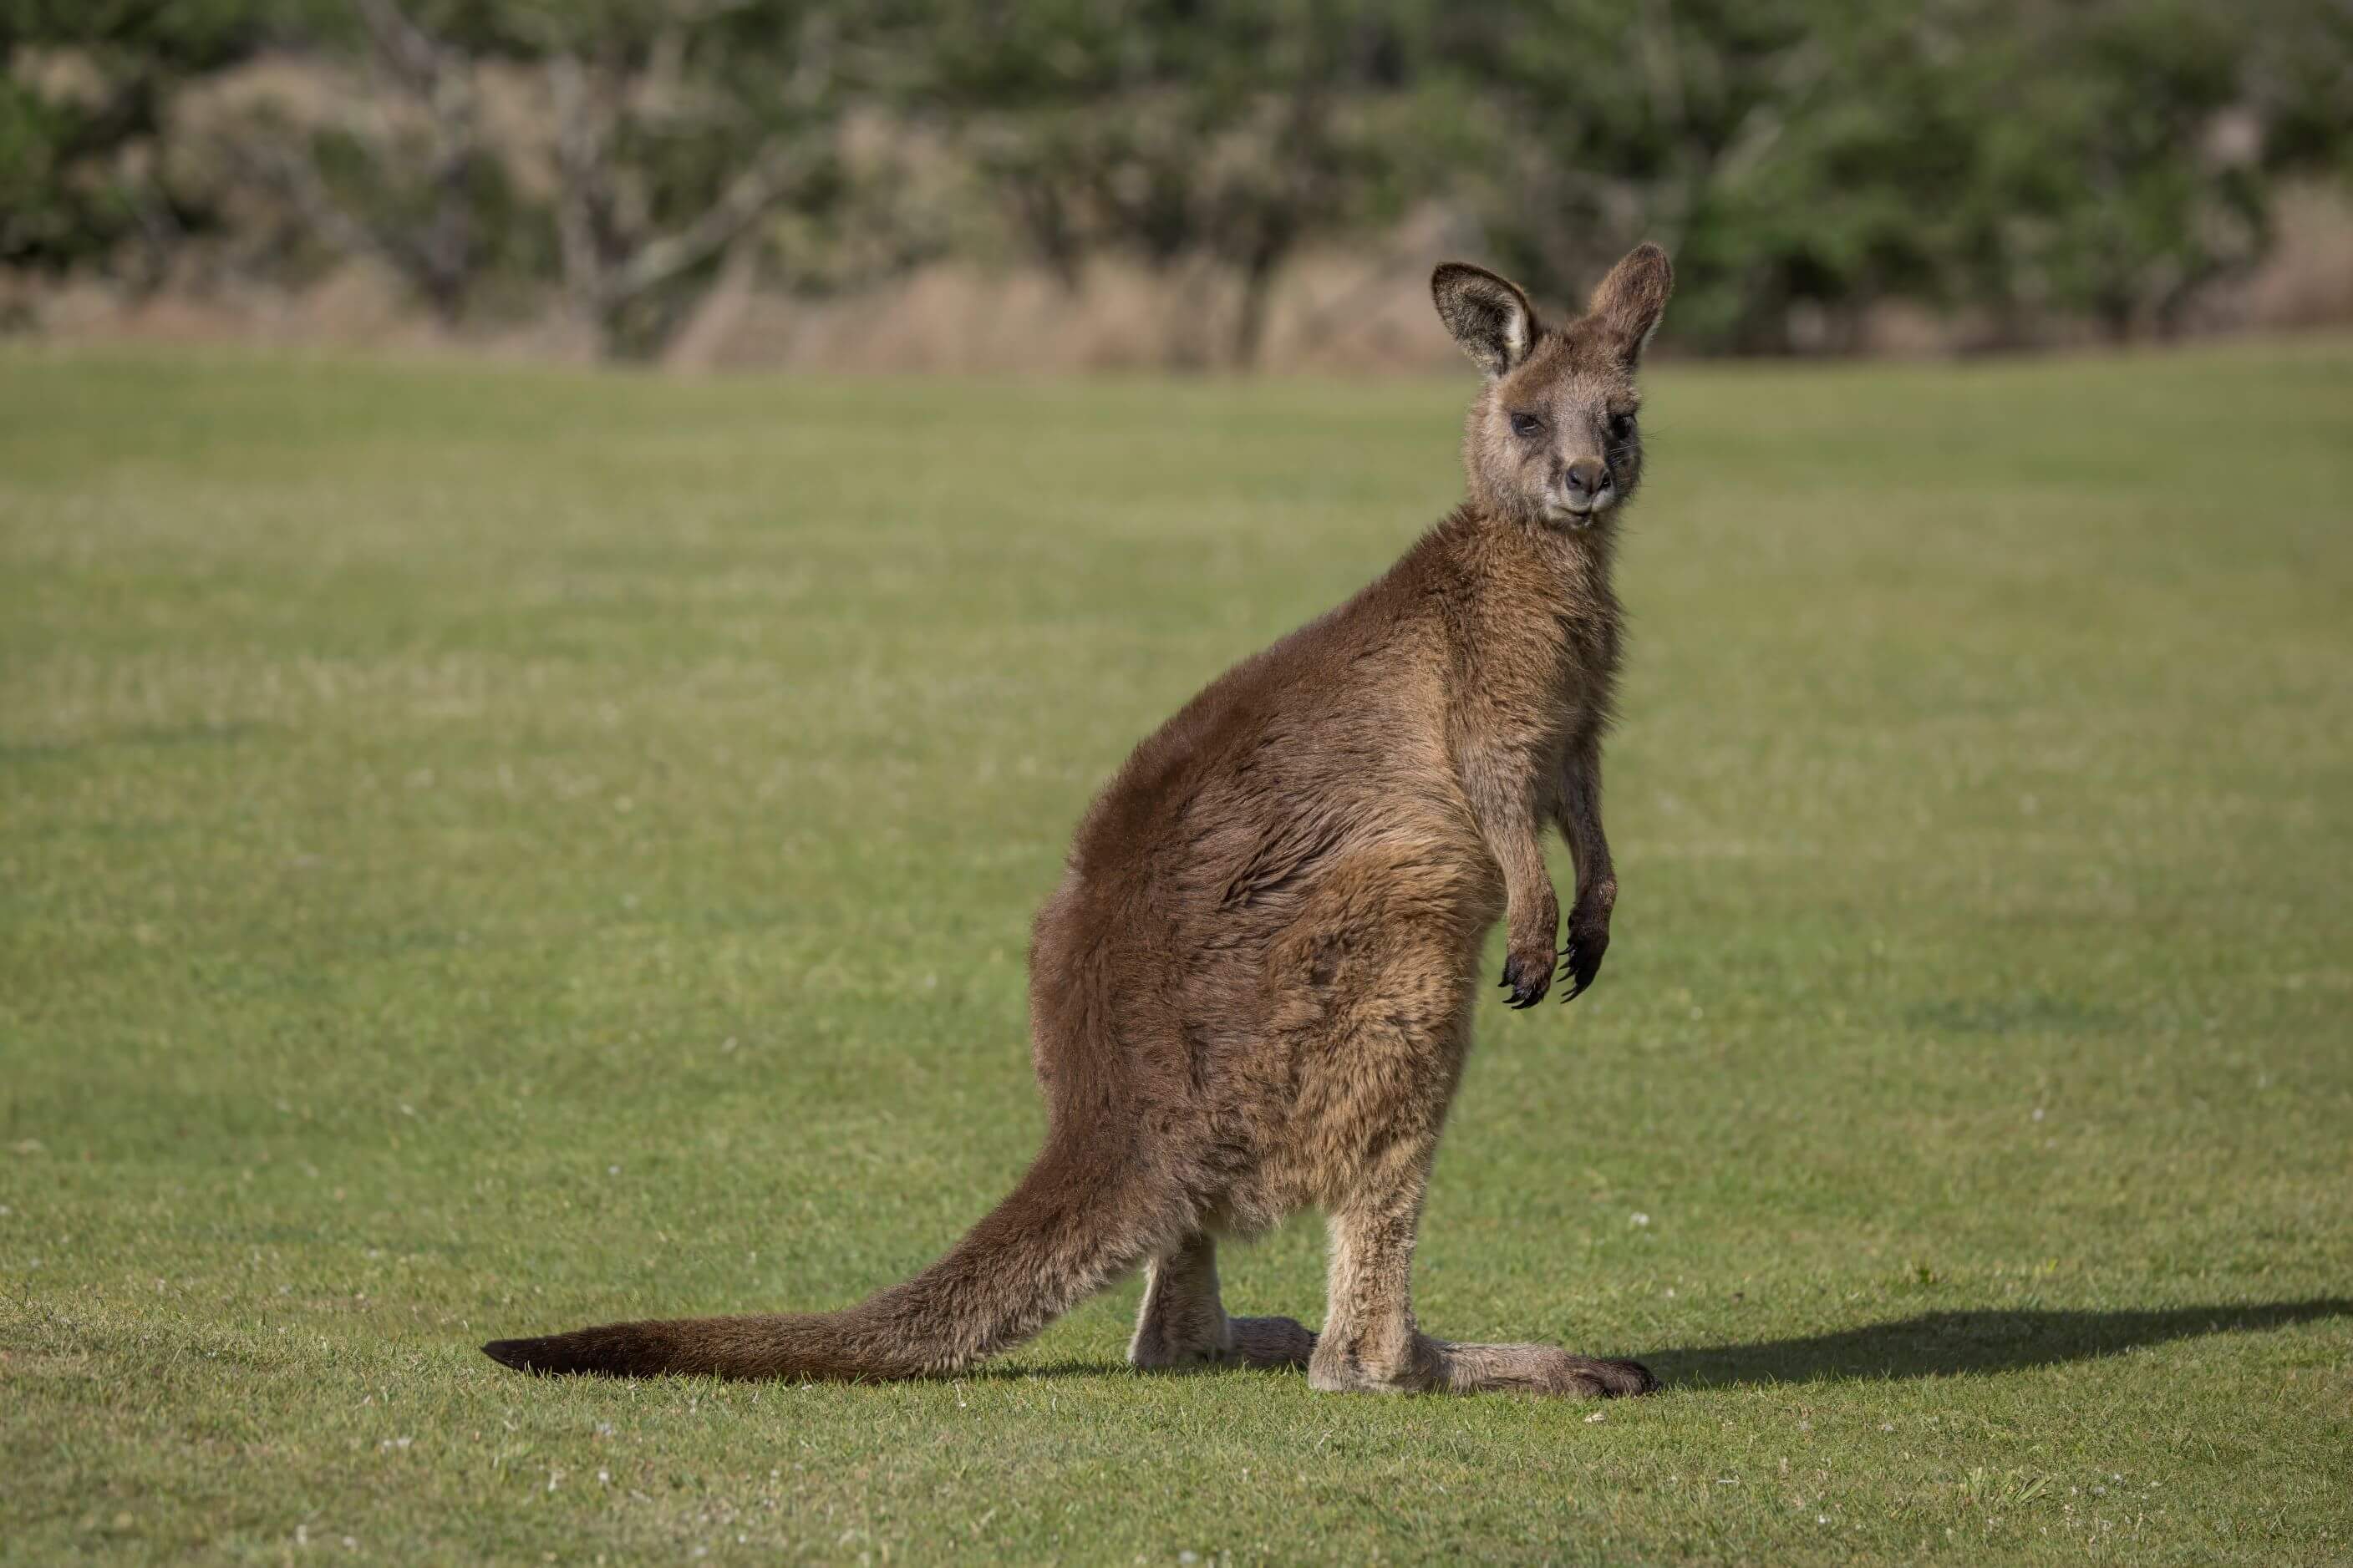
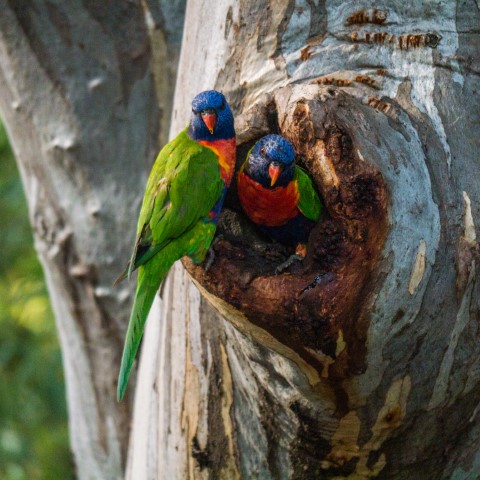
- Kangaroo, wallaby, koala, emu, cassowary, wombat, possum, kookaburra, magpie, crocodile etc. Student responses will vary based on their location in Australia, and their past experiences.
- Do you know what makes these animals special? Do you know what being a 'native animal' means?
- It means that the animal only lives in the wild in that particular place. You might see them in other countries now, but that is because humans have taken them there.
Discuss how First Nations Peoples made observations about the features of native animals by displaying some First Nations traditional art, as well as modern art.
- What features can you see on this animal?
- Which First Nations Peoples would have drawn this animal?
- Looking closely at the features of the animal, what animal do you think it is?
- What senses did Aboriginal and Torres Strait Islander Peoples people use when they were observing animals?
- Art (dance) was represented differently during different seasons, why do you think this may have been so?
Highlight that Aboriginal and Torres Strait Islander Peoples have been building their scientific knowledge for thousands of years, using scientific observations of what was happening around them to learn all about plants and animals.
Alternatively, students can examine the images on Australian coins by:
- using a magnifying glass to make observations, identifying the animals on the coins and any features that can see.
- making a coin rubbing by placing a coin under the paper and rubbing/colouring with pencil, using medium pressure.
Discuss why the animal identified are important enough to be on an Australian coin.
Using the cards created with the Animal Cards Resource sheet, play a game of Who am I?: A student pulls a card from a lucky dip and describes the animal’s features without saying its name. The remaining students use the information to figure out what animal it is. Repeat with more cards. You might choose to only play lucky dip with the Australian native animal cards, you might use the common animal cards, or a combination of both.
Provide each student/pair of students with an animal card. Students discuss the animal on their card, identifying the features of that animal together.
Students sort the animal cards into categories by 'buddying' up with another pair based on a teacher given prompt. For example, Find another pair whose animal...
- has a tail.
- has the same number of legs as your animal.
- lives in the water/sky/on land etc.
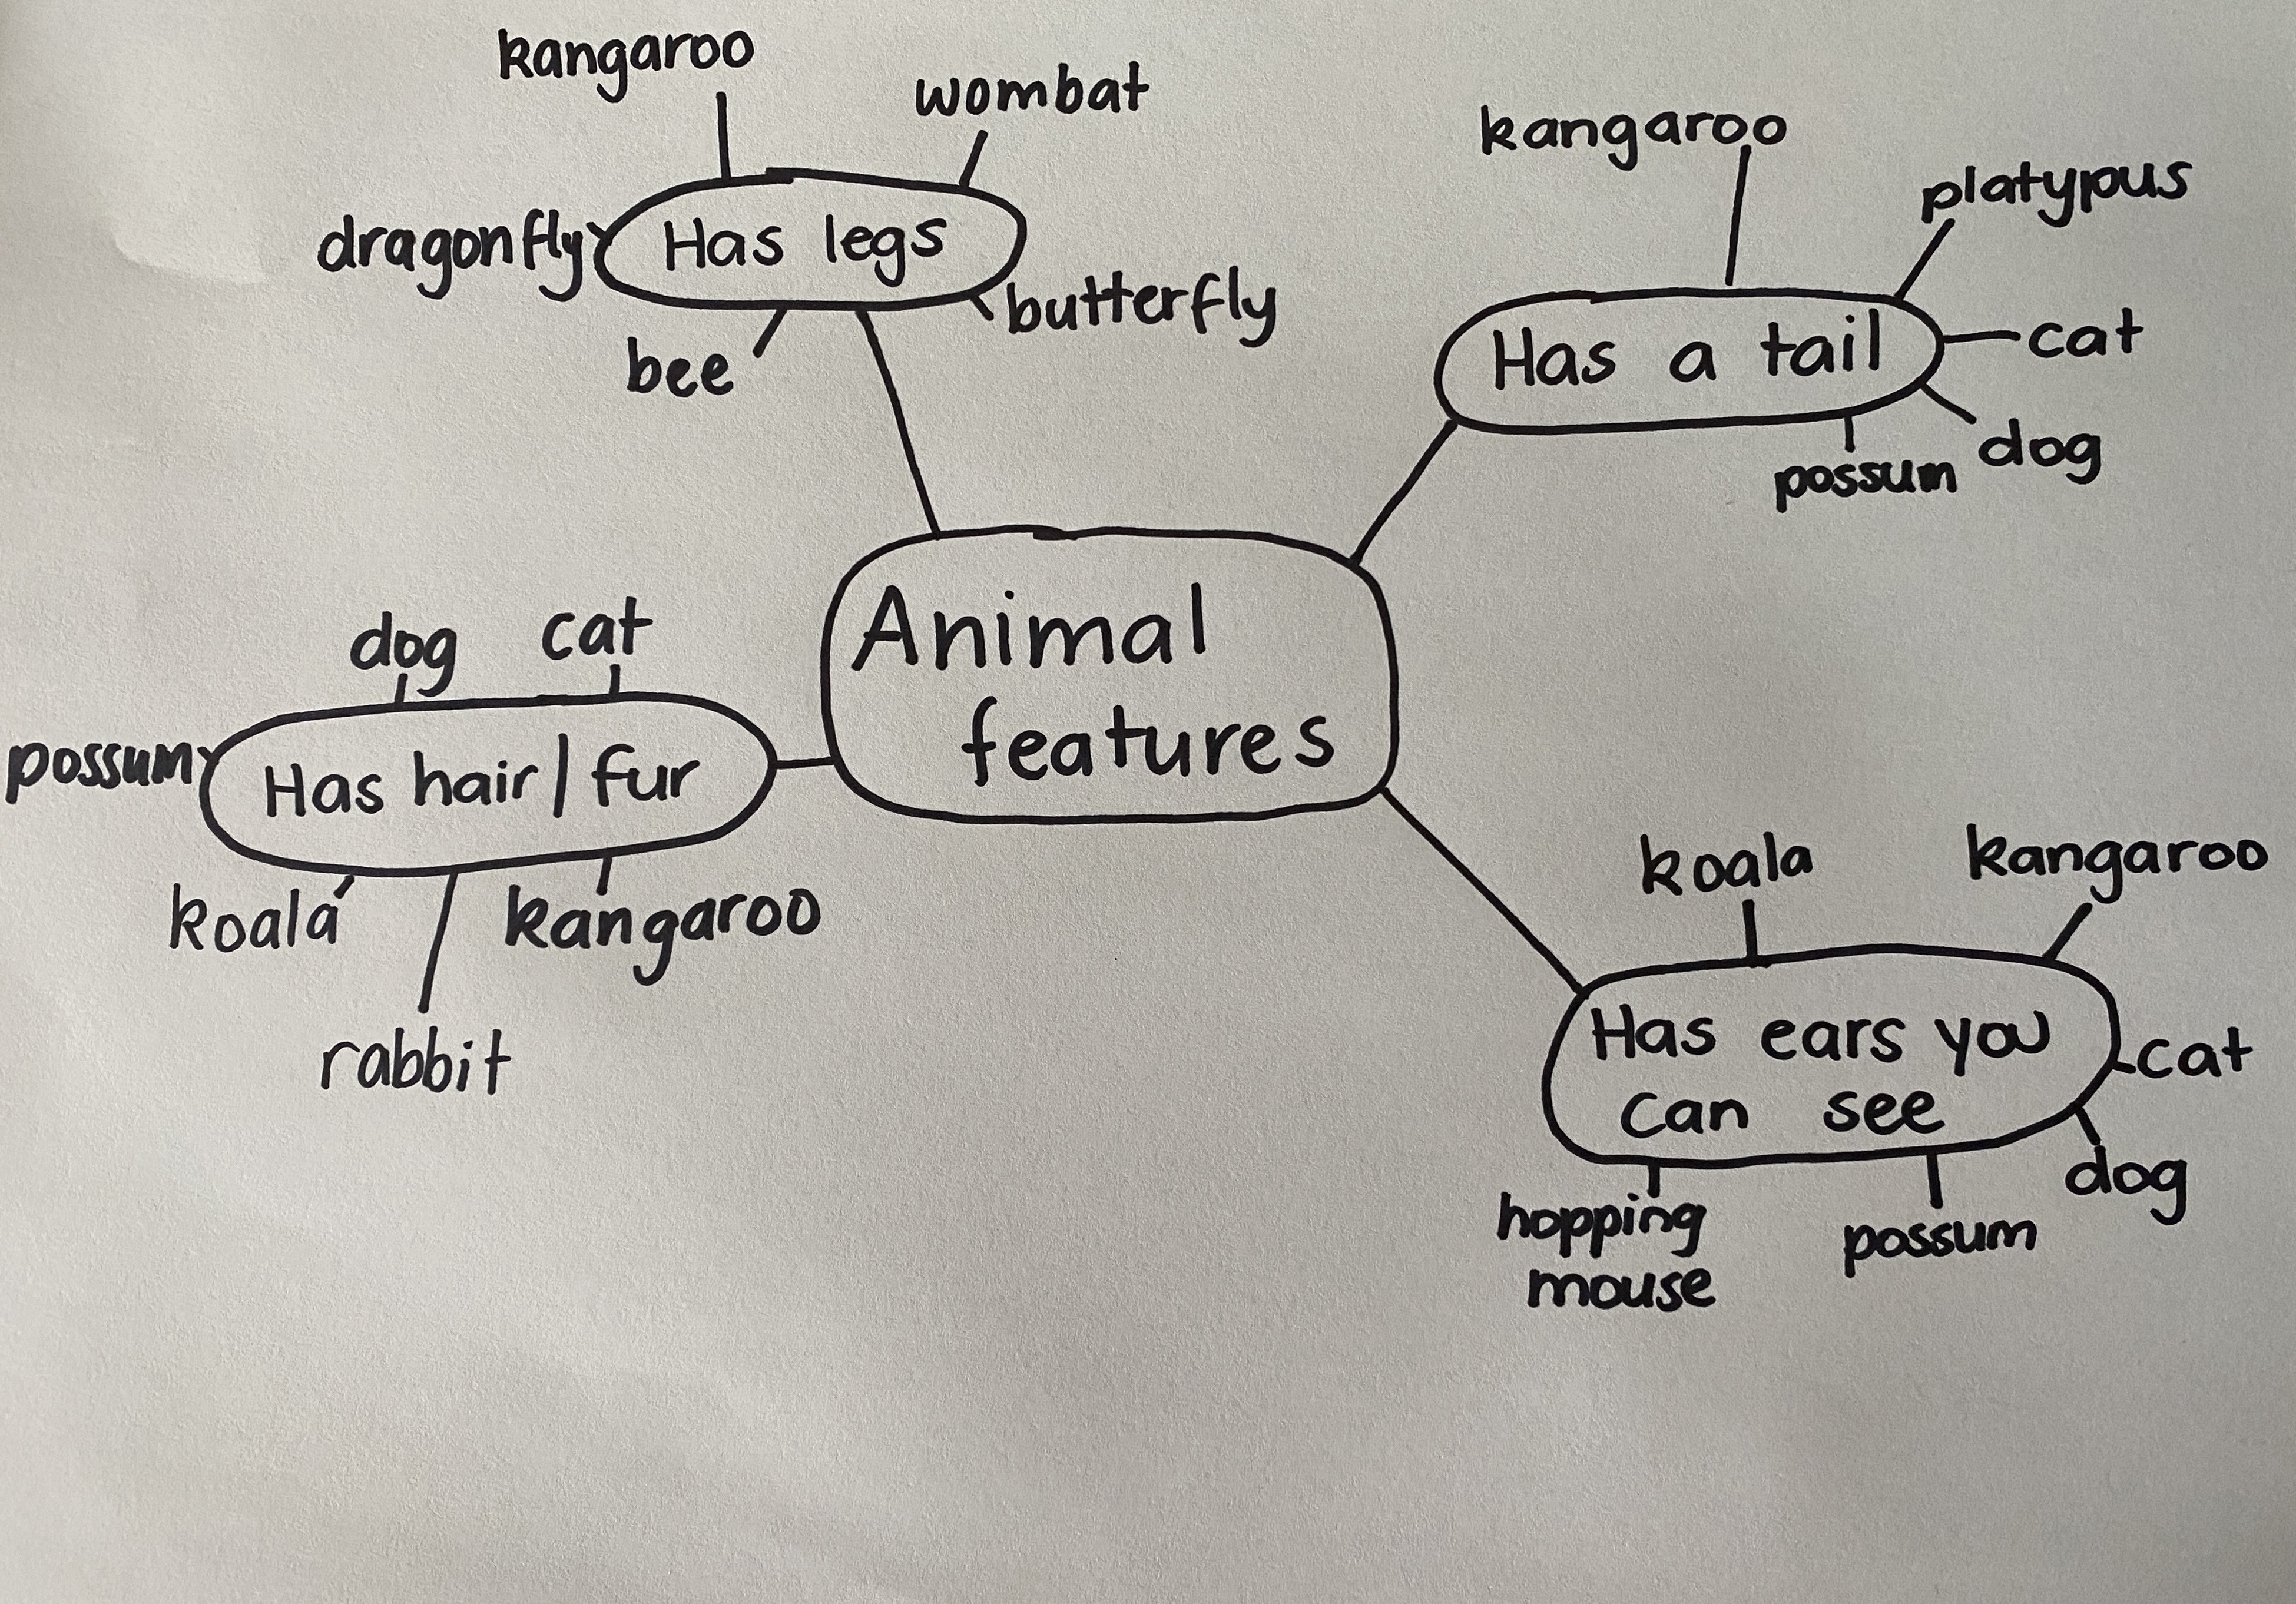
Record the responses after each round on an ideas map entitled "Sorting animal features", organising them so that students can see the categories clearly.
Aboriginal and Torres Strait Islander peoples knowledge about animals
Aboriginal and Torres Strait Islander peoples have observed living organisms in their environment for millennia.
So far, this teaching sequence has focused on the Western science criteria for grouping plants and animals according to their observable features.
Aboriginal and Torres Strait Islander peoples have observed living organisms in their environment for millennia, noting the external features of the organisms, as well as their movements, and their relationship with the land and what that indicates. Stories, songs, dances and paintings have long been a way in which they document, preserve and communicate knowledge.
Consider working with local Aboriginal and Torres Strait Islander communities to find out how the traditional custodians of the lands on which your school is found grouped animals, and why. Alternatively, locate published materials that explores these. Ensure these materials have been made available in accordance with First Nations’ Peoples notions of knowledge sharing.
Sorting animals—connecting to Mathematics
There are multiple ways to sort the animals. Understanding your students’ mathematical capability will help to guide how this is done.
There are multiple ways to sort the animals based on their observable features. Understanding your students’ mathematical capability will help to guide any decisions you make when adapting the animal sorting activities (after the Who am I? activity) to your students’ needs, and provide guidance on when support for students may be required.
At Foundation, students “collect, sort and compare data represented by objects in response to given investigative questions that relate to familiar situations.” (AC9MFST01)
In Year 1, students "make, compare and classify familiar shapes; recognise familiar shapes and objects in the environment, identifying the similarities and differences between them." (AC9M1SP01)
In the animal activities, the sorting students might be expected to do overlaps these content descriptions.
Consider what support your students might need, if any, in order to sort animals by their observable features, for example those with or without tails, those with two legs, four legs or no legs etc. Students may be more prepared to sort animals into categories at this stage, as they have had a similar learning experience when sorting leaves.
The Inquire phase allows students to cycle progressively and with increasing complexity through the key science ideas related to the core concepts. Each Inquire cycle is divided into three teaching and learning routines that allow students to systematically build their knowledge and skills in science and incorporate this into their current understanding of the world.
When designing a teaching sequence, it is important to consider the knowledge and skills that students will need in the final Act phase. Consider what the students already know and identify the steps that need to be taken to reach the level required. How could you facilitate students’ understanding at each step? What investigations could be designed to build the skills at each step?
Read more about using the LIA FrameworkFollowing an investigation, the Integrate routine provides time and space for data to be evaluated and insights to be synthesized. It reveals new insights, consolidates and refines representations, generalises context and broadens students’ perspectives. It allows student thinking to become visible and opens formative feedback opportunities. It may also lead to further questions being asked, allowing the Inquire phase to start again.
When designing a teaching sequence, consider the diagnostic assessment that was undertaken during the Launch phase. Consider if alternative conceptions could be used as a jumping off point to discussions. How could students represent their learning in a way that would support formative feedback opportunities? Could small summative assessment occur at different stages in the teaching sequence?
Read more about using the LIA FrameworkExplaining thinking
Discuss the groupings recorded on the mind map.
- Do any of the animals belong in two categories? Which ones can you see?
- Why do they fit into more than one category?
- Animals have more than one feature, and are all different from each other. For example, a magpie has a tail, and a dog has a tail. But a magpie has two legs and a dog has four.
- What features do all/most of the animals you looked at today have in common?
- Most have eyes and a mouth at least, and many will have ears, noses and some sort of body covering as well.
- What other ways could you have sorted the animals?
- If all the animals were baby animals, would that change any of the groupings?
- Do humans have any of the same features as the animals you looked at today?
- How were you observing like scientists today? What sense did you mostly use?
- We used our sense of sight to look at the features of animals, and group animals together with other animals with the same features. Scientists like to group things together.
Reflect on the lesson
You might:
- add relevant words and images to the class word wall.
- discuss whether the students have any new questions about animal features and add them to the first page of the class science journal.
- group similar questions to identify whether any of the new student questions are likely to be answered in the upcoming lessons.