Making sense of changes
View Sequence overviewStudents will:
- observe and compare the viscosity of a variety of liquids.
- add or remove heat to/from the liquids and measure the change in viscosity.
Students will represent their understanding as they:
- predict, with reasoning, which liquid will flow the fastest or slowest.
- record their observations and explanations.
- discuss liquids of different viscosity and how adding and removing heat changes the viscosity.
In this lesson, assessment is formative.
Feedback might focus on:
- students’ reasoning for their liquid race predictions. Did they predict that the less viscous liquids would flow more easily and faster?
- students’ explanation for the race results. Did students recognise that the added/removed heat changed the viscosity of the liquid and affected race times?
- students’ predictions for the liquids prepared for cooling. Do students predict that the liquids will become more viscous or solid by placing them in the fridge/freezer?
Whole class
Class science journal (digital or hard-copy)
Liquid samples with different viscosities, for both demonstration and racing. For example water, honey, washing up liquid, oil, cordial, shampoo/conditioner, tomato sauce.
Large flat tray or book to create a slope
3 x sheets of greaseproof paper (the race sheets), approximately the length of the book or tray above, each marked identically with:
- a Start and Finish line.
- the distance between the Start and Finish line.
Texta
Ruler
A means of attaching the race sheets securely to the slope, for example pegs, clips, blu-tac, sticky tape
Demonstration copy of The great race Resource sheet
Devices for recording video and taking photos
Stop watch or timing device
A method for warming liquid samples, e.g. a warm water bath, heat bag or hot water bottle. Microwaves are not recommended as they can cook the liquid, or give the perception of cooking the liquid.
A method for cooling liquid samples, e.g. an ice bath or ice brick
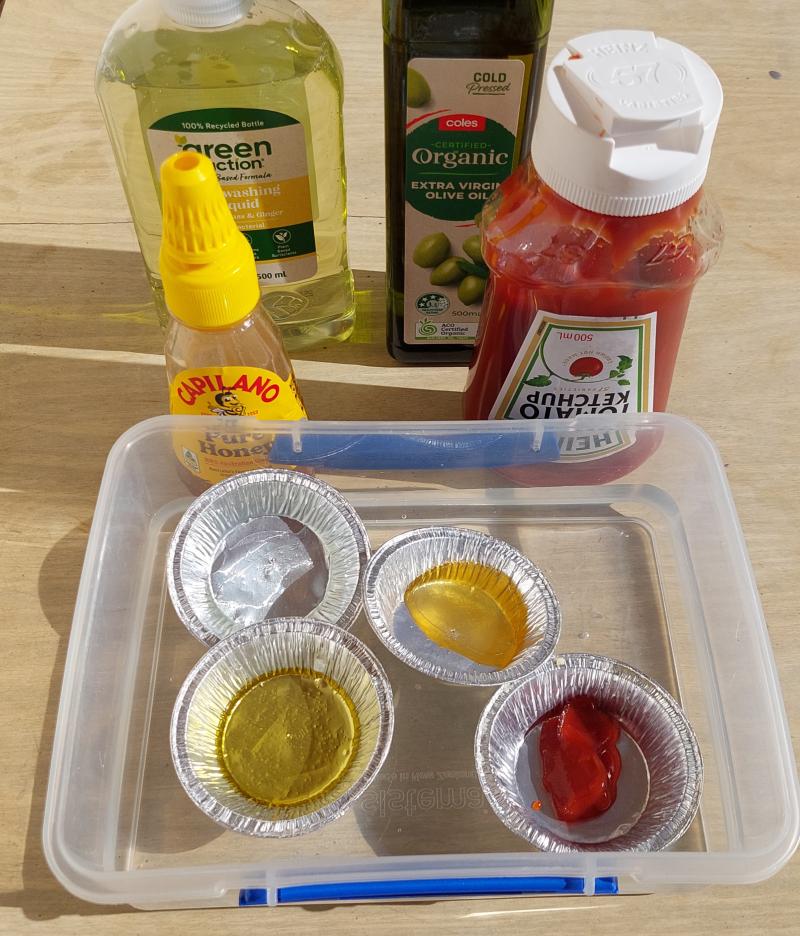
Optional: Small containers such as patty pans or pie trays to place small amounts of liquids in for warming and cooling (number of containers needed will depend on the number of liquids tested)
Optional: What is viscosity? (1:29)
Each student
Individual science journal (digital or hard-copy)
The great race Resource sheet
Lesson
Re-orient
Use the class science journal to review what was learned and discussed about liquids in the previous lesson.
The Inquire phase allows students to cycle progressively and with increasing complexity through the key science ideas related to the core concepts. Each Inquire cycle is divided into three teaching and learning routines that allow students to systematically build their knowledge and skills in science and incorporate this into their current understanding of the world.
When designing a teaching sequence, it is important to consider the knowledge and skills that students will need in the final Act phase. Consider what the students already know and identify the steps that need to be taken to reach the level required. How could you facilitate students’ understanding at each step? What investigations could be designed to build the skills at each step?
Read more about using the LIA FrameworkIdentifying and constructing questions is the creative driver of the inquiry process. It allows students to explore what they know and how they know it. During the Inquire phase of the LIA Framework, the Question routine allows for past activities to be reviewed and to set the scene for the investigation that students will undertake. The use of effective questioning techniques can influence students’ view and interpretation of upcoming content, open them to exploration and link to their current interests and science capital.
When designing a teaching sequence, it is important to spend some time considering the mindset of students at the start of each Inquire phase. What do you want students to be thinking about, what do they already know and what is the best way for them to approach the task? What might tap into their curiosity?
Read more about using the LIA FrameworkFast or slow?
Look at some samples of liquids viewed in the last lesson, and some that will be used in the upcoming investigation.
Discuss how easily the liquids ‘flow’, and demonstrate by shaking them in their container or pouring/squeezing some out. Ask students if they think some liquids flow more easily than others and why or why not.
Pose the question: Which liquid will flow the fastest, and which will flow the slowest?
The Inquire phase allows students to cycle progressively and with increasing complexity through the key science ideas related to the core concepts. Each Inquire cycle is divided into three teaching and learning routines that allow students to systematically build their knowledge and skills in science and incorporate this into their current understanding of the world.
When designing a teaching sequence, it is important to consider the knowledge and skills that students will need in the final Act phase. Consider what the students already know and identify the steps that need to be taken to reach the level required. How could you facilitate students’ understanding at each step? What investigations could be designed to build the skills at each step?
Read more about using the LIA FrameworkThe Investigate routine provides students with an opportunity to explore the key ideas of science, to plan and conduct an investigation, and to gather and record data. The investigations are designed to systematically develop content knowledge and skills through increasingly complex processes of structured inquiry, guided inquiry and open inquiry approaches. Students are encouraged to process data to identify trends and patterns and link them to the real-world context of the teaching sequence.
When designing a teaching sequence, consider the diagnostic assessment (Launch phase) that identified the alternative conceptions that students held. Are there activities that challenge these ideas and provide openings for discussion? What content knowledge and skills do students need to be able to complete the final (Act phase) task? How could you systematically build these through the investigation routines? Are there opportunities to build students’ understanding and skills in the science inquiry processes through the successive investigations?
Read more about using the LIA FrameworkThe great race
In this step, students will compare the viscosity of different liquids by racing them down a slope. They will compare the ‘flow’ of the liquids before and after heating and cooling.
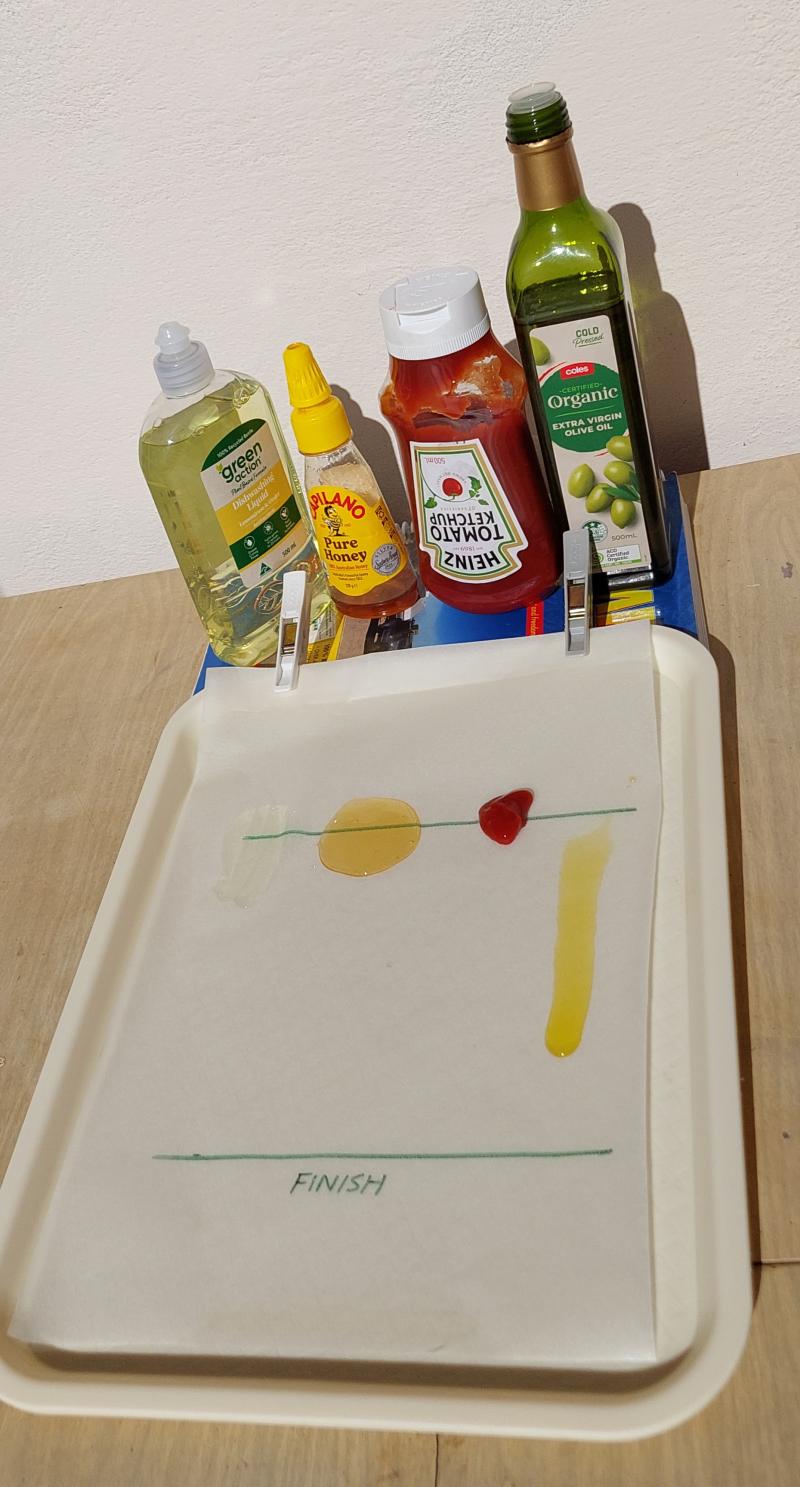
Explain that a blob of each liquid will be placed along one end of a tray. Then the tray will be raised to create a slope, to see which liquid will flow down the slope the fastest.
Discuss the meaning of the term ‘room temperature’—the liquid is the same temperature as the room—and how students can be sure that all the liquids are at room temperature.
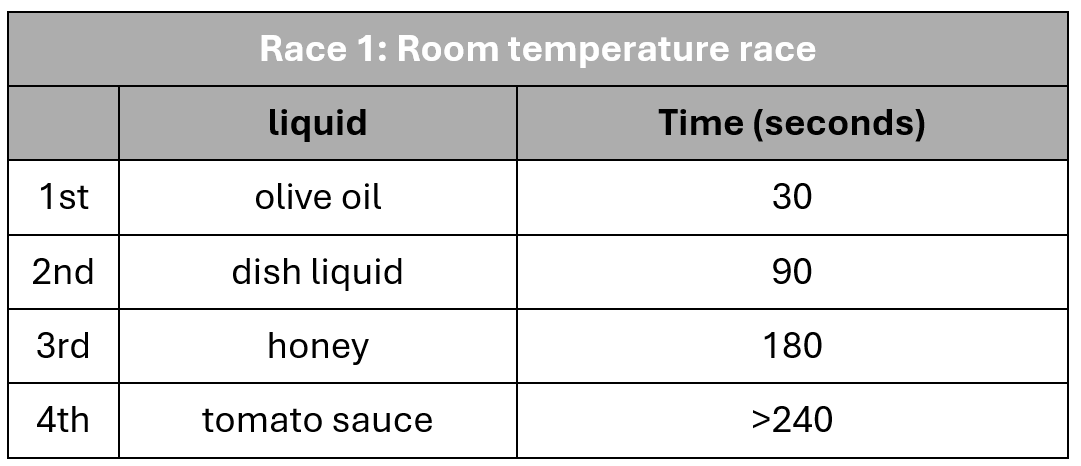
Using the Race 1: Room temperature race row on their The great race Resource sheet, students Predict which liquid they think will flow the fastest and which will flow the slowest, and give a Reason for that.
Set up the race, following the steps below.
- Nominate a student to video the race so it can be re-watched at a later stage.
- Nominate a student/s to time the race using a stop-watch or timing device.
- Attach a sheet of greaseproof paper (the race sheet) to a large flat surface such as a tray, large book or tub using pegs, blu-tac etc. The race sheet should already be marked with:
- a Start and Finish line.
- the distance between the Start and Finish line.
- Place a blob of each type of liquid on the starting line. Try to ensure that each blob is the same size.
- Optional: Discuss why using the same amount of liquid in each blob is important to keep the test fair.
- Raise one end of the tray/book/tub to a set height to create a slope, for example by propping it on some books.
- As soon as the end is raised, begin timing how long it takes each liquid to cross the finish line.
- Students who are timing should announce the time it took each liquid to cross the finish line.
- Record the results.
On The great race Resource sheet, students record their observations, determine if their predictions were correct, and Explain what they think happened by comparing the ‘flow’ of each liquid (which finished first, which last, and was it what they expected).
Explain to students that you are going to complete the race two more times, using the same liquids, but in one race the liquids will be heated so they are above room temperature and in the other they will be cooled so they are below room temperature. Discuss what students think about how changing the temperature of the liquids might affect their 'flow'.
Students write their predictions on The great race Resource sheet for Race 2: Warmed up race and Race 3: Cooled down race.
Heat one set of liquid samples to above room temperature using a warm water bath or other method. Cool another set of samples to below room temperature by placing them in a refrigerator, ice-bath, or similar.
Follow the race steps outlined above for the heated and cooled liquids, with students recording their observations and explanations in the appropriate sections on The great race Resource sheet.
Predict, Reason, Observe, Explain (PROE)
What is PROE and how does it support my students with science inquiry?
PROE is a tool to engage students in the investigative process and support deep thinking. It affords students experience with developing argumentation skills through science inquiry, and supports you, the teacher, to monitor their thinking in order to guide the inquiry.
At this stage, student predictions will be based on their everyday experiences with the materials they are working with. They will likely be able to predict that liquids will flow down the ramp or they may have seen a parent heat honey in a microwave to remove the last dregs from a container. Students may find it more difficult to make predictions about materials that they have less experience with, or might compare an unfamiliar material with a more familiar one. These are valid ways of making predictions.
Viscosity
What is viscosity, and how does heating and cooling liquids change their viscosity?
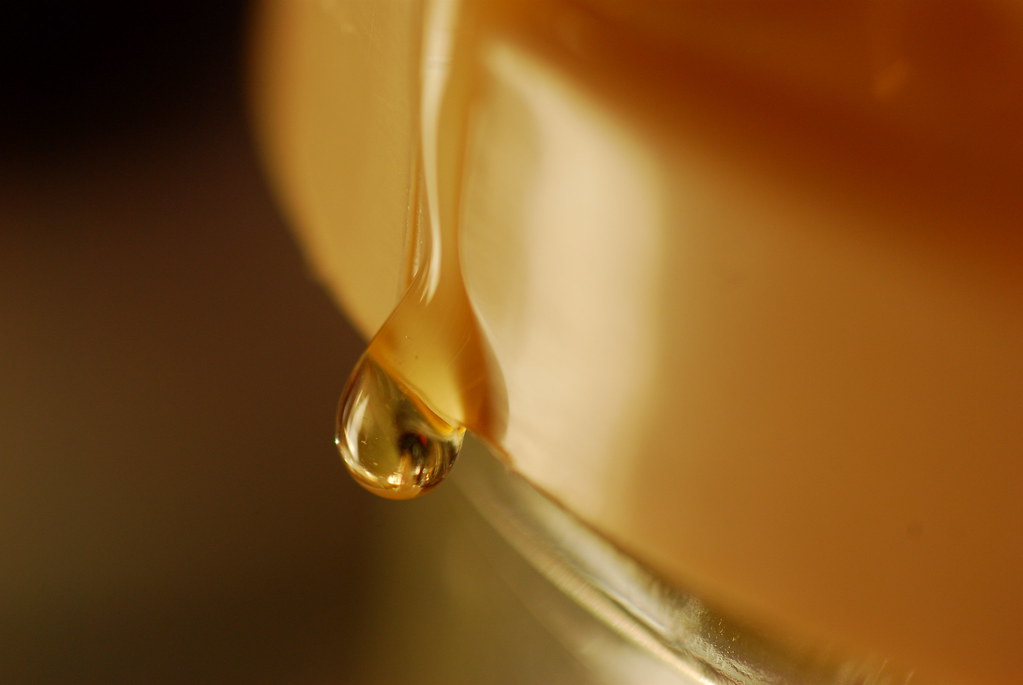
Viscosity is a measure of a liquid’s resistance to movement or flow. A liquid with high viscosity flows slowly, while one with low viscosity flows more easily. For example, honey is highly viscous because it flows slowly, whereas water has low viscosity and flows readily.
Students might describe viscosity in simpler terms:
- Viscous—thick or not runny (e.g. honey)
- Not very viscous—thin or runny (e.g. water)
In general, the viscosity of most liquids decreases as temperature increases (i.e. a hot liquid becomes more ‘runny’).
When heat energy is added to a liquid, each of the particles gains energy to move (the heat energy is transferred to the particle and is transformed into movement energy). This means the particles can overcome the intermolecular forces that resist flow more easily; that is, they are able to flow over one another more easily.
When heat energy is removed, the particles lose movement energy and cannot flow over each other as freely.
For instance, oil in a hot frying pan is less viscous than the same oil when it’s cold. Similarly, honey flows more easily (is less viscous) at room temperature than when it’s stored in the fridge.
Link to Mathematics
How can I link learning about viscosity to Mathematics?
The statistics content of the Australian Curriculum (V9) requires students to:
- acquire data for categorical and discrete numerical variables to address a question of interest or purpose by observing, collecting and accessing data sets; record the data using appropriate methods including frequency tables and spreadsheets (AC9M3ST01)
- create and compare different graphical representations of data sets including using software where appropriate; interpret the data in terms of the context (AC9M3ST02)
- conduct guided statistical investigations involving the collection, representation and interpretation of data for categorical and discrete numerical variables with respect to questions of interest (AC9M3ST03)
By using the data collected about the time it takes for liquids to ‘cross the finish line’, students have the opportunity to collect and represent numerical data and create and compare different graphical representation in order to answer questions of interest directly related to their learning in science.
The Making Decisions with Data lesson sequence by reSolve provides excellent guidance on how you might explore the mathematics content in depth alongside students’ learning in science.
In this sequence students first construct stories and explanations to interpret information shown of unlabelled graphs. In doing so they have the opportunity to think about the data represented by a graph in a different way, considering the many questions it may be answering, what the scale might be, and the type of information a bar graph is suitable to represent.
Next students collect, organise, represent and interpret data about the viscosity of various liquids.
During your Science lesson you might focus simply on the fastest and slowest liquids, and students’ understanding for the reasons for that. This can then be followed up with a more detailed analysis during a Mathematics lesson.
Please note that the lesson linked to above was originally written to suit the Australian Curriculum V8.4 at a Year 5 level. However, with guidance it is easily accessible by Year 3 students, and aligns will with the Statistics content at Year 3 of the Australian Curriculum V9.
The Inquire phase allows students to cycle progressively and with increasing complexity through the key science ideas related to the core concepts. Each Inquire cycle is divided into three teaching and learning routines that allow students to systematically build their knowledge and skills in science and incorporate this into their current understanding of the world.
When designing a teaching sequence, it is important to consider the knowledge and skills that students will need in the final Act phase. Consider what the students already know and identify the steps that need to be taken to reach the level required. How could you facilitate students’ understanding at each step? What investigations could be designed to build the skills at each step?
Read more about using the LIA FrameworkFollowing an investigation, the Integrate routine provides time and space for data to be evaluated and insights to be synthesized. It reveals new insights, consolidates and refines representations, generalises context and broadens students’ perspectives. It allows student thinking to become visible and opens formative feedback opportunities. It may also lead to further questions being asked, allowing the Inquire phase to start again.
When designing a teaching sequence, consider the diagnostic assessment that was undertaken during the Launch phase. Consider if alternative conceptions could be used as a jumping off point to discussions. How could students represent their learning in a way that would support formative feedback opportunities? Could small summative assessment occur at different stages in the teaching sequence?
Read more about using the LIA FrameworkRace analysis
In this Integrate step, guide students to link their experiences in the investigation to the science concept being explored—in this instance, the observable properties of liquids and how adding or removing heat can change their properties. Through questioning and discussion, students should come to a consensus that:
|
Discuss the race results, how each liquid ‘flows’, and if heating and cooling the liquids changed the race times or the order they crossed the finish line.
- Why did liquid X cross the finish line first?
- Why did liquid Y cross the finish line last?
- Did the liquids flow faster and finish quicker when we added heat? Removed heat? Why do you think that happened?
- What do you think would happen if we added more heat to the liquids or made them hotter or colder? Would it make them flow faster or slower?
Introduce the term ‘viscosity’, in relation to liquids: how much a liquid resists flowing.
Determine which liquids were viscous/not viscous, and jointly construct sentences using the data collected as evidence. Record these sentences in the class science journal. For example:
- Honey is considered viscous because it doesn’t flow easily. It flowed slowly, taking 180 seconds to cross the finish line.
- Water is not viscous because it flowed easily, crossing the finish line in just a few seconds.
Discuss whether heating or cooling changed the viscosity of the liquids.
Optional: View the video What is viscosity? (1:29).
Using the think-pair-share strategy, students consider how they might use what they have learned about viscosity, heating and cooling liquids in the sensory experience they design. Record ideas in the class science journal. Some examples to prompt thinking might include:
- How might tomato sauce in an ice bath feel different/flow differently from tomato sauce in a warm water bath?
- What could we pour quickly between our hands, and what might pour slowly?
- How would different liquids feel if we pushed our hands into them? Would the feeling change if they were heated or cooled?
- How could we use what we’ve learned to create a sensory experience?
Reflect on the lesson
You might:
- add to the class word wall any vocabulary related to liquids, viscosity, and how adding heat changed the viscosity of the liquids, for example, viscous, thick, sticky, syrupy, runny, thin, pourable, adding heat, removing heat.
- re-examine the intended learning goals for the lesson and consider how they were achieved.
- construct a joint explanation about viscosity, including examples of the liquids explored in the lesson.
- write a list of other liquids whose viscosity students would like to test.
Language use—adding and removing heat energy
Why do we use the terms adding/removing heat energy rather than heating and cooling?
Scientifically speaking, cold is not a phenomena in and of itself, but rather is the absence of heat energy.
A day might be described as ‘cold’ when there is less solar radiation (the heat from the sun) reaching the Earth's surface. Similarly, on a ‘hot’ day there is an abundance of thermal radiation reaching the Earth's surface. Note that there are many factors involved in this that are not specifically relevant to this teaching sequence.
To make something ‘hot’ heat energy needs to be added. To keep it ‘hot’, the object’s heat energy is conserved in the object. To make something ‘cool’ or ‘cold’, heat energy needs to be transferred elsewhere.
An object or substance with more heat energy will always transfer its heat energy to an object or substance with less heat energy when they come into contact.
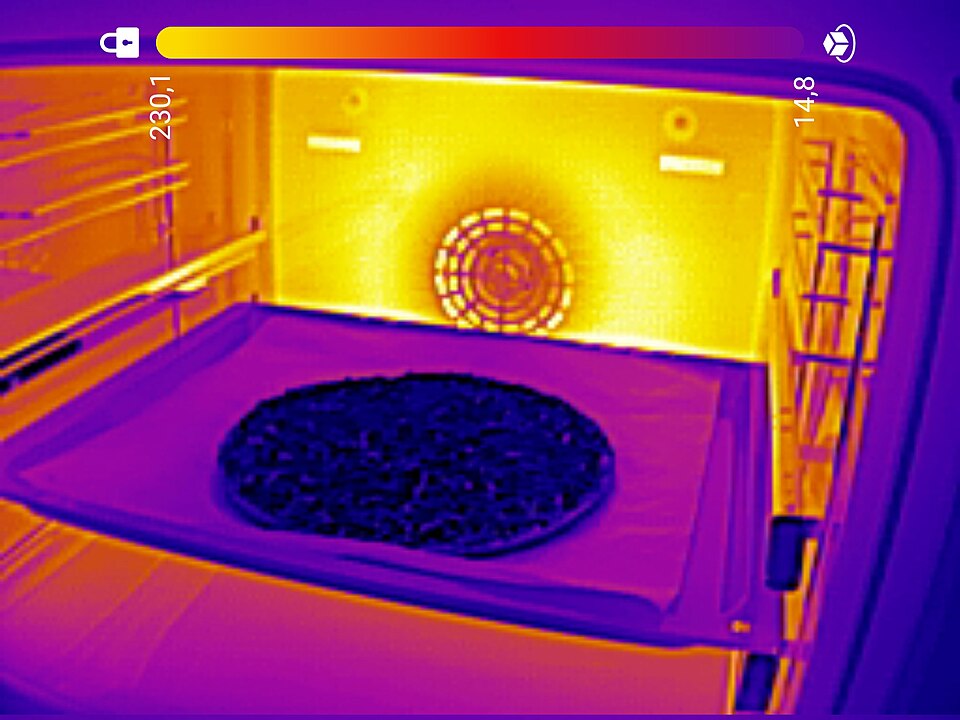
For example, when you put food into a hot oven, the heat energy circulating in the air in the oven will heat the food until the food is the same temperature as the oven air.
Similarly, when you place something into a refrigerator, the heat from that item will be transferred into the air inside the fridge. The mechanisms in the fridge remove this heat from inside the refrigerator and dissipate it into the atmosphere outside. Specifically, the low-pressure gas contained in the evaporator coils absorbs heat from the air inside the fridge. This, now warm gas, then moves to the compressor where the pressure is increased, increasing the temperature further. This now very hot gas is transferred to the condenser, which moves the hot gas to the back outer surface of the fridge. The condenser gas then transfers the heat energy to the atmosphere outside the fridge. This is why the back of the fridge can increase the heat energy in a room.
Using the term ‘adding heat energy’ or ‘removing heat energy’ provides an opportunity to reinforce the core science concept that heat energy is transferred and transformed, and cannot be created or destroyed. It also avoids potentially reinforcing any alternative conceptions students might have. This is especially important in Year 3 as the Physical sciences content covered is specifically about heat energy.
Scientifically speaking, cold is not a phenomena in and of itself, but rather is the absence of heat energy.
A day might be described as ‘cold’ when there is less solar radiation (the heat from the sun) reaching the Earth's surface. Similarly, on a ‘hot’ day there is an abundance of thermal radiation reaching the Earth's surface. Note that there are many factors involved in this that are not specifically relevant to this teaching sequence.
To make something ‘hot’ heat energy needs to be added. To keep it ‘hot’, the object’s heat energy is conserved in the object. To make something ‘cool’ or ‘cold’, heat energy needs to be transferred elsewhere.
An object or substance with more heat energy will always transfer its heat energy to an object or substance with less heat energy when they come into contact.
For example, when you put food into a hot oven, the heat energy circulating in the air in the oven will heat the food until the food is the same temperature as the oven air.
Similarly, when you place something into a refrigerator, the heat from that item will be transferred into the air inside the fridge. The mechanisms in the fridge remove this heat from inside the refrigerator and dissipate it into the atmosphere outside. Specifically, the low-pressure gas contained in the evaporator coils absorbs heat from the air inside the fridge. This, now warm gas, then moves to the compressor where the pressure is increased, increasing the temperature further. This now very hot gas is transferred to the condenser, which moves the hot gas to the back outer surface of the fridge. The condenser gas then transfers the heat energy to the atmosphere outside the fridge. This is why the back of the fridge can increase the heat energy in a room.
Using the term ‘adding heat energy’ or ‘removing heat energy’ provides an opportunity to reinforce the core science concept that heat energy is transferred and transformed, and cannot be created or destroyed. It also avoids potentially reinforcing any alternative conceptions students might have. This is especially important in Year 3 as the Physical sciences content covered is specifically about heat energy.