

What‘s great for growth?
View Sequence overviewStudents will:
- define “physical conditions”.
- measure the physical conditions of a habitat, including temperature, light and moisture.
- recognise that physical conditions within habitats can vary.
Students will represent their understanding as they:
- use a table to tally survey information.
- contribute to a scientific display.
- predict with reasoning how the habitat conditions directly or indirectly affect local species.
In this lesson, assessment is formative.
Feedback might focus on:
- the accuracy of data students collected.
- the feasibility of the conclusions students draw about conditions affecting local species.
- the generalisations students make, relating their specific survey to a broader context.
Whole class
Class science journal (digital or hard-copy)
Demonstration copy of the Conditions survey Resource sheet
An image of a birds-eye view of a familiar local habitat (e.g. using Google Earth/Google Maps)
Access to the schoolyard or local site to survey physical conditions of a habitat. Select a site that contains locations where conditions noticeably vary in terms of temperature, light, shade and moisture levels. For example, the area under a large, dense bush will likely be noticeably cooler, darker and more moist than a nearly patch of ground in full sun. Some suitable sites include a garden bed, food forest, nearby park, garden, bushland, rockpool/wetland.
Each group
Thermometer or digital temperature sensor
Clipboard
Pen/pencil
Tablet or device with light meter app (optional)
Soil moisture meter (optional)
Digital device for taking photos and video (optional)
Each student
Individual science journal (digital or hard-copy)
Conditions survey Resource sheet
Lesson
The Inquire phase allows students to cycle progressively and with increasing complexity through the key science ideas related to the core concepts. Each Inquire cycle is divided into three teaching and learning routines that allow students to systematically build their knowledge and skills in science and incorporate this into their current understanding of the world.
When designing a teaching sequence, it is important to consider the knowledge and skills that students will need in the final Act phase. Consider what the students already know and identify the steps that need to be taken to reach the level required. How could you facilitate students’ understanding at each step? What investigations could be designed to build the skills at each step?
Read more about using the LIA FrameworkRe-orient
Share and compare recently collected data about the growth of the radishes (or alternative), discussing the conditions teams have attempted to maintain at each location.
- What conditions has your plant been growing in?
- How many hours of sunlight has your seed received each day?
- How much water have you added to your pot?
- Roughly what temperature range has your plant been exposed to, day and night?
- How have the conditions helped or hindered growth?
Students continue the radish race for 3-6 weeks, depending on the radish variety and growing conditions, then determine which radishes grew “best”.
The Inquire phase allows students to cycle progressively and with increasing complexity through the key science ideas related to the core concepts. Each Inquire cycle is divided into three teaching and learning routines that allow students to systematically build their knowledge and skills in science and incorporate this into their current understanding of the world.
When designing a teaching sequence, it is important to consider the knowledge and skills that students will need in the final Act phase. Consider what the students already know and identify the steps that need to be taken to reach the level required. How could you facilitate students’ understanding at each step? What investigations could be designed to build the skills at each step?
Read more about using the LIA FrameworkIdentifying and constructing questions is the creative driver of the inquiry process. It allows students to explore what they know and how they know it. During the Inquire phase of the LIA Framework, the Question routine allows for past activities to be reviewed and to set the scene for the investigation that students will undertake. The use of effective questioning techniques can influence students’ view and interpretation of upcoming content, open them to exploration and link to their current interests and science capital.
When designing a teaching sequence, it is important to spend some time considering the mindset of students at the start of each Inquire phase. What do you want students to be thinking about, what do they already know and what is the best way for them to approach the task? What might tap into their curiosity?
Read more about using the LIA FrameworkWhat do we have here?
Introduce the term “physical conditions” as a term scientists use to include all of the non-living features/elements of a habitat/environment.
Ask students to list what they think the “non-living elements” of a habitat are. See the embedded professional learning Physical conditions of an environment below for further information that may help guide the discussion as students give responses.
Relate the concept of physical conditions to the examples students explored in Lesson 1:
- the temperature, water/moisture and light levels etc. in the place where students are growing their radishes (or alternative).
- the temperature of the water surrounding the Great Barrier Reef.
Using a printed photo or Google Earth/Google Maps, display a birds-eye view of a familiar local habitat. This may include the school grounds, a local park or bushland. List/label what students can see (or know is present) in the habitat (e.g. buildings, bushland, sources of water) and what plants and animals they think/know live in the habitat.
Pose the question: What temperature, light and moisture conditions do we expect to find in this habitat today?
Students make a prediction of what they will find based on their existing knowledge of the place.
Physical conditions of an environment
What does “physical conditions” mean?
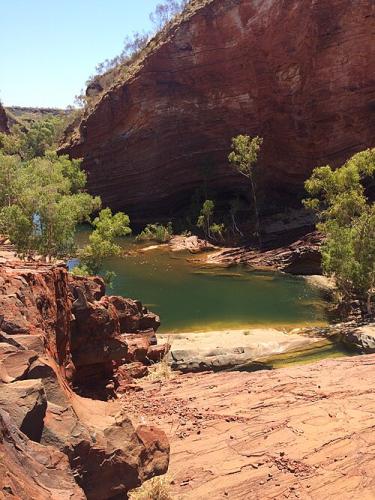
The conditions of an environment are the physical, chemical and biological factors that surround and affect living organisms. They can be living (biotic) and non-living (abiotic).
In this sequence students learn about the physical conditions of environments and what can happen to species when these physical conditions change.
Physical conditions refer specifically to the non-living features/elements of an environment, which can be natural and man-made.
Natural physical conditions can be interconnected and include:
- climate and weather. Temperature ranges, rainfall, humidity levels and wind patterns all set limits for the survival of plants and animals in an environment.
- water and moisture. Proximity to oceans, lakes, rivers and other bodies of water (both fresh and salt) as well as rainfall and how water moves through the landscape all impact the quality and quantity of the water living things have access to.
- light and heat. The intensity of the sunlight, level of exposure and the length of daylight hours influences energy production and plant growth.
- geography and landform. Altitude, topology (the presence of hills, valleys etc.), rock type, soil type, and soil pH levels all impact what is able to live in an environment.
- air and atmosphere. Levels of carbon dioxide vs oxygen in the air, air pressure etc. affect the environment.
Man-made physical conditions are those human actions that have an impact on the natural conditions. For example:
- air and water purity. Human activities such as manufacturing and farming can impact the air and water quality in an environment.
- changes to the landscape. Clearing vegetation, building roads and cities (which in turn changes the light levels), and damming rivers all affect the natural conditions of an environment.
The physical conditions of an environment directly impact the development, survival, health and balance of the living things within it. Over time, all living things have adapted to survive and thrive within a specific range of conditions. Changes to these physical conditions of an environment that are outside this range can become a challenge for the survival of a species.
The conditions of an environment are the physical, chemical and biological factors that surround and affect living organisms. They can be living (biotic) and non-living (abiotic).
In this sequence students learn about the physical conditions of environments and what can happen to species when these physical conditions change.
Physical conditions refer specifically to the non-living features/elements of an environment, which can be natural and man-made.
Natural physical conditions can be interconnected and include:
- climate and weather. Temperature ranges, rainfall, humidity levels and wind patterns all set limits for the survival of plants and animals in an environment.
- water and moisture. Proximity to oceans, lakes, rivers and other bodies of water (both fresh and salt) as well as rainfall and how water moves through the landscape all impact the quality and quantity of the water living things have access to.
- light and heat. The intensity of the sunlight, level of exposure and the length of daylight hours influences energy production and plant growth.
- geography and landform. Altitude, topology (the presence of hills, valleys etc.), rock type, soil type, and soil pH levels all impact what is able to live in an environment.
- air and atmosphere. Levels of carbon dioxide vs oxygen in the air, air pressure etc. affect the environment.
Man-made physical conditions are those human actions that have an impact on the natural conditions. For example:
- air and water purity. Human activities such as manufacturing and farming can impact the air and water quality in an environment.
- changes to the landscape. Clearing vegetation, building roads and cities (which in turn changes the light levels), and damming rivers all affect the natural conditions of an environment.
The physical conditions of an environment directly impact the development, survival, health and balance of the living things within it. Over time, all living things have adapted to survive and thrive within a specific range of conditions. Changes to these physical conditions of an environment that are outside this range can become a challenge for the survival of a species.
The Inquire phase allows students to cycle progressively and with increasing complexity through the key science ideas related to the core concepts. Each Inquire cycle is divided into three teaching and learning routines that allow students to systematically build their knowledge and skills in science and incorporate this into their current understanding of the world.
When designing a teaching sequence, it is important to consider the knowledge and skills that students will need in the final Act phase. Consider what the students already know and identify the steps that need to be taken to reach the level required. How could you facilitate students’ understanding at each step? What investigations could be designed to build the skills at each step?
Read more about using the LIA FrameworkThe Investigate routine provides students with an opportunity to explore the key ideas of science, to plan and conduct an investigation, and to gather and record data. The investigations are designed to systematically develop content knowledge and skills through increasingly complex processes of structured inquiry, guided inquiry and open inquiry approaches. Students are encouraged to process data to identify trends and patterns and link them to the real-world context of the teaching sequence.
When designing a teaching sequence, consider the diagnostic assessment (Launch phase) that identified the alternative conceptions that students held. Are there activities that challenge these ideas and provide openings for discussion? What content knowledge and skills do students need to be able to complete the final (Act phase) task? How could you systematically build these through the investigation routines? Are there opportunities to build students’ understanding and skills in the science inquiry processes through the successive investigations?
Read more about using the LIA FrameworkComparing conditions
Explain to students that they will survey the amount of light, temperature and moisture at the local habitat they have identified. They should select three locations where they think the temperature, light and water levels will vary.
Before the survey
Model for students how to:
- measure temperature, light and moisture at the sites (see the embedded professional learning Measuring temperature, light and moisture for more information).
- record results on the Conditions survey Resource sheet.
Discuss how else students might collect and record data about the conditions in a specific area. For example:
- taking photos showing light levels.
- recording a video of any pooling water or obvious moisture.
- making sound recordings of dry, crackling leaves to show that it is dry.
Discuss safety considerations, such as weather protection and any potentially harmful animals such as spiders, snakes, bees and ants.
Ensure students collect all necessary equipment for the survey, including appropriate clothing and footwear.
During the survey
Visit the local habitat you have identified.
Allow teams time to survey the physical conditions at multiple, varying plots within the habitat, such as full sun compared to shaded, and record that data on their copy of the Conditions survey Resource sheet. The data will be shared with the class during the Integrate phase. Where necessary, for example in a small area with several teams, teams should survey only one plot each and record their data.
Measuring temperature, light and moisture
How do we measure light, temperature and moisture conditions?
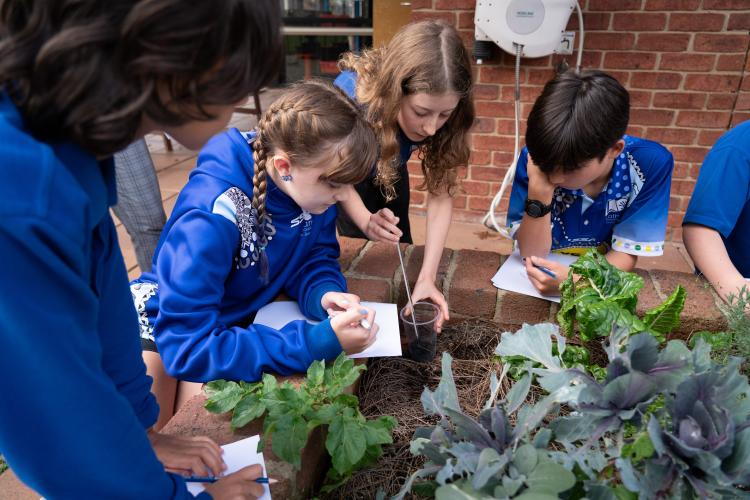
A field survey in a local habitat provides an opportunity for students to collect data on temperature, light and moisture and to consider how conditions change over varying time scales and potentially impact local species.
Temperature
Measuring outdoor/air temperature helps us to monitor environmental conditions that influence processes such as weather patterns, plant growth, and animal activity. The temperature can be measured using a thermometer or a digital temperature sensor.
Meteorologists measure air temperature by placing a thermometer in a white louvred box called a Stevenson screen. The boxes are placed 1.5-2 m above the ground. Students can model this by measuring the temperature in a well-ventilated, shaded area approximately 1.5-2 m above the ground. Leave the thermometer for a few minutes to adjust to the surrounding air before the temperature reading is recorded. This allows the data collected by students to be compared to the historic data collected by other scientists.
However, it is important to note that these air temperature readings do not factor in wind, humidity or direct sunlight. These conditions may also affect the growth and survival of species. For instance, if the actual temperature measures in the low 20°Cs, but a plant receives 5-6 hours of direct sunlight a day, it might actually be experiencing temperatures much higher than this. This is why it is important to collect data across a range of metrics.
Light
A light meter is a device used to measure the intensity of light in an environment. It contains a sensor that detects incoming light and converts it into an electrical signal proportional to the brightness of the light. The meter then displays the measurement in lux, the standard unit of illuminance. One lux represents one lumen of light distributed over one square metre of surface area.
For this survey, a simple light meter app can be installed on digital devices. Alternatively, students can observe the light and shadows and decide whether full sun, partial shade or deep shade best describes the light conditions.
By measuring light levels in lux, a light meter can help determine how much light plants receive in different environments. For example, in forests, the canopy often reduces light reaching the ground, creating low-lux conditions suitable for shade-tolerant plants, while open fields typically have much higher lux levels that support sun-loving species. In gardens, measuring lux can help gardeners choose appropriate planting locations or adjust shade structures so that plants receive the amount of light they need for healthy growth and photosynthesis.
Moisture
Soil moisture can be measured using a soil moisture meter or probe inserted into the ground. To take a measurement, the probe is pushed into the soil near the plant roots and left briefly until the reading stabilises. The result is usually displayed on a scale or as a percentage of moisture. Alternatively (or additionally), touch the soil by hand, feeling the soil between your fingers to estimate whether it is dry, slightly moist, or wet.
Measuring soil moisture helps determine whether plants have enough or too much water and can guide decisions about water harvesting techniques for fields and natural environments.
A field survey in a local habitat provides an opportunity for students to collect data on temperature, light and moisture and to consider how conditions change over varying time scales and potentially impact local species.
Temperature
Measuring outdoor/air temperature helps us to monitor environmental conditions that influence processes such as weather patterns, plant growth, and animal activity. The temperature can be measured using a thermometer or a digital temperature sensor.
Meteorologists measure air temperature by placing a thermometer in a white louvred box called a Stevenson screen. The boxes are placed 1.5-2 m above the ground. Students can model this by measuring the temperature in a well-ventilated, shaded area approximately 1.5-2 m above the ground. Leave the thermometer for a few minutes to adjust to the surrounding air before the temperature reading is recorded. This allows the data collected by students to be compared to the historic data collected by other scientists.
However, it is important to note that these air temperature readings do not factor in wind, humidity or direct sunlight. These conditions may also affect the growth and survival of species. For instance, if the actual temperature measures in the low 20°Cs, but a plant receives 5-6 hours of direct sunlight a day, it might actually be experiencing temperatures much higher than this. This is why it is important to collect data across a range of metrics.
Light
A light meter is a device used to measure the intensity of light in an environment. It contains a sensor that detects incoming light and converts it into an electrical signal proportional to the brightness of the light. The meter then displays the measurement in lux, the standard unit of illuminance. One lux represents one lumen of light distributed over one square metre of surface area.
For this survey, a simple light meter app can be installed on digital devices. Alternatively, students can observe the light and shadows and decide whether full sun, partial shade or deep shade best describes the light conditions.
By measuring light levels in lux, a light meter can help determine how much light plants receive in different environments. For example, in forests, the canopy often reduces light reaching the ground, creating low-lux conditions suitable for shade-tolerant plants, while open fields typically have much higher lux levels that support sun-loving species. In gardens, measuring lux can help gardeners choose appropriate planting locations or adjust shade structures so that plants receive the amount of light they need for healthy growth and photosynthesis.
Moisture
Soil moisture can be measured using a soil moisture meter or probe inserted into the ground. To take a measurement, the probe is pushed into the soil near the plant roots and left briefly until the reading stabilises. The result is usually displayed on a scale or as a percentage of moisture. Alternatively (or additionally), touch the soil by hand, feeling the soil between your fingers to estimate whether it is dry, slightly moist, or wet.
Measuring soil moisture helps determine whether plants have enough or too much water and can guide decisions about water harvesting techniques for fields and natural environments.
The Inquire phase allows students to cycle progressively and with increasing complexity through the key science ideas related to the core concepts. Each Inquire cycle is divided into three teaching and learning routines that allow students to systematically build their knowledge and skills in science and incorporate this into their current understanding of the world.
When designing a teaching sequence, it is important to consider the knowledge and skills that students will need in the final Act phase. Consider what the students already know and identify the steps that need to be taken to reach the level required. How could you facilitate students’ understanding at each step? What investigations could be designed to build the skills at each step?
Read more about using the LIA FrameworkFollowing an investigation, the Integrate routine provides time and space for data to be evaluated and insights to be synthesized. It reveals new insights, consolidates and refines representations, generalises context and broadens students’ perspectives. It allows student thinking to become visible and opens formative feedback opportunities. It may also lead to further questions being asked, allowing the Inquire phase to start again.
When designing a teaching sequence, consider the diagnostic assessment that was undertaken during the Launch phase. Consider if alternative conceptions could be used as a jumping off point to discussions. How could students represent their learning in a way that would support formative feedback opportunities? Could small summative assessment occur at different stages in the teaching sequence?
Read more about using the LIA FrameworkDisplaying the data
In the following Integrate routine, students are guided to link their experiences on a micro level surveying the physical conditions of a habitat with the science at a macro level, that is, that different physical conditions exist within all habitats. Through modelling, questioning and discussion, students should come to a consensus that:
|
After the survey
Discuss any challenges students faced collecting data on the physical conditions in the habitat/environment, for example:
- moving clouds may have resulted in changing light measurements.
- the ground may have been too rocky or hard to insert the probe, or dig up to assess moisture levels.
As a class, create a display of the shared survey data (temperature, moisture, light) on the classroom wall. Discuss any differences in measurements from the same locations. For example, the amount of light measured without cloud should be considered more accurate than the amount of light measured as a cloud shadow moved across the same area.
Discuss how the physical conditions surveyed might:
- vary slightly from one plot to another because of the physical structure of the land (for example, having a tree canopy, the land being on a slope, the time of day, the compass point orientation of the land i.e. it faces west).
- directly or indirectly affect the local species over varying time scales.
Record ideas in the class science journal.
- How is your group’s data similar or different from other groups?
- Can we see any patterns in our class data?
- What’s a good way to display our results so everyone can understand them?
- How could things like shade from trees, slopes, or compass point direction (which way it faces) change temperature, light, or moisture?
- Which measurement (temperature, light, or moisture) changed the most between each group? Why?
- How might temperature, moisture, and light affect the plants and animals living there?
- Can you think of a plant or animal that would like one type of habitat more than another? Why?
- If there was a sudden change in the landscape, for example, a heavy rainstorm, how would the living things be affected?
- What about a slow change, for example, a worsening drought where water/moisture dried up slowly over time?
- If we did this again at a different time (summer, winter etc.), would we get the same results? Why or why not? How will this affect our plant or animal?
- What types of plants would thrive in the conditions observed, and how would that affect our plant or animal?
- How have humans changed this landscape, and how has this changed the conditions?
Invite students to add any questions/concerns they have about conditions affecting local species to the class display.
Retain survey data and leave the classroom display intact for reference through the sequence and when the survey is repeated in Lesson 7.
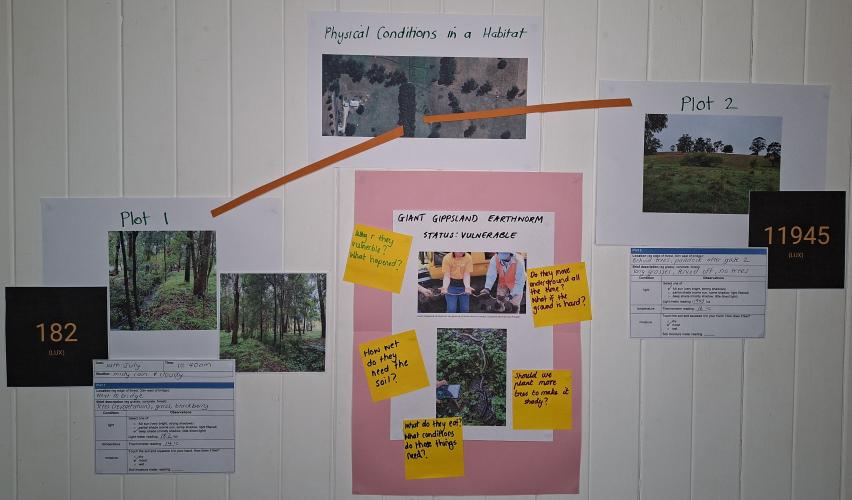
Determine with students what they have learned on a micro level, and how it might apply from a macro perspective. Record these in the class science journal. See the Step purpose section at the beginning of this step for details that might guide your discussion.
Reflect on the lesson
You might:
- consider the original question posed before the investigation: What temperature, light and moisture conditions do we expect to find in this habitat today? Compare students’ survey results with their predictions.
- add to the class word wall or glossary any relevant words and images related to measurable habitat conditions such as temperature, light and moisture.
- add to the L and H sections of the TWLH chart. Students should focus on what they have Learned and link it to the evidence they collected in the lesson that shows How they know they learned that. For example: I learned that light conditions can vary inside a habitat. I proved this when I used the lux meter app and took readings at several plots inside the same habitat.
Class display of data
What could be part of the class data display?
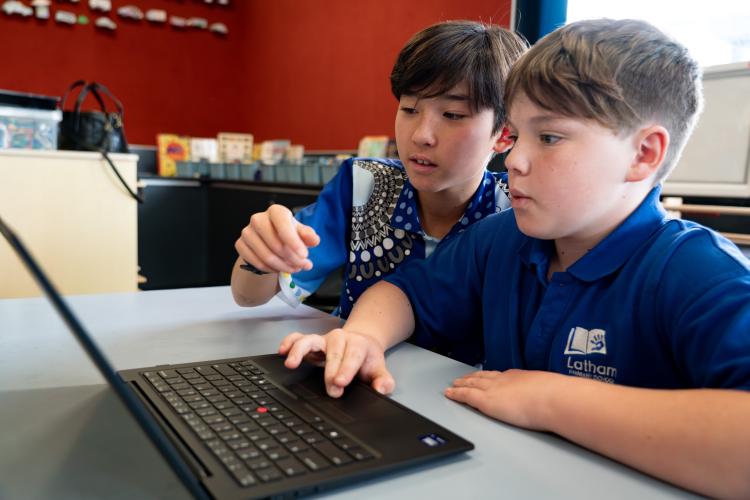
Creating a classroom display of survey data provides students with an evolving reference for them to see patterns over time. As students continue through the sequence and learn more about the physical conditions and their effect on the survival of living things, the display provides a tangible link to the local habitat and species.
The display might include:
- survey data.
- satellite images from Google Maps.
- ground level photos taken by students.
- screenshots of light lux readings.
- graphs.
- student sketches.
Creating a classroom display of survey data provides students with an evolving reference for them to see patterns over time. As students continue through the sequence and learn more about the physical conditions and their effect on the survival of living things, the display provides a tangible link to the local habitat and species.
The display might include:
- survey data.
- satellite images from Google Maps.
- ground level photos taken by students.
- screenshots of light lux readings.
- graphs.
- student sketches.