

What‘s great for growth?
View Sequence overviewStudents will:
- set up and monitor a fair test.
- recognise that duckweed growth correlates to the conditions it is growing in.
Students will represent their understanding as they:
- record growth in a data table.
- graph results and write a summary statement.
In this lesson, assessment is formative.
Feedback might focus on:
- students’ claims (with supporting evidence and reasoning) about conditions affecting duckweed growth.
- the conclusions that students draw about conditions affect growth.
- the representations students generated.
- the generalisations students made about how changing conditions can affect the growth and survival of all species.
Whole class
Class science journal (digital or hard-copy)
Video: How do you grow duckweed? (1:27)
Demonstration copy of the Variables grid Resource sheet
Video: Duckweed, the good the bad and the ugly (4:38)
Each group
Minimum 20 x duckweed fronds, which includes leaves, stem and roots (more if you have sourced a smaller species). See Preparing for this sequence or the embedded professional learning All about duckweed in the Question routine of this lesson for essential information about duckweed.
Water
2 x jars/cups
Access to locations or equipment to change one variable when growing duckweed, such as:
- a spoon or pop stick for stirring
- light and dark areas
- nutrients such as compost tea, worm juice or fish food
Each student
Individual science journal (digital or hard-copy)
Duckweed investigation planner Resource sheet
Lesson
The Inquire phase allows students to cycle progressively and with increasing complexity through the key science ideas related to the core concepts. Each Inquire cycle is divided into three teaching and learning routines that allow students to systematically build their knowledge and skills in science and incorporate this into their current understanding of the world.
When designing a teaching sequence, it is important to consider the knowledge and skills that students will need in the final Act phase. Consider what the students already know and identify the steps that need to be taken to reach the level required. How could you facilitate students’ understanding at each step? What investigations could be designed to build the skills at each step?
Read more about using the LIA FrameworkRe-orient
If still continuing the radish race, share and compare recently collected data about the growth of the radishes (or other seeds), discussing how their growth has changed since they were first planted, particularly in relation to the conditions they are growing in.
- Which radishes are growing “the best” so far? Why do you think that?
- Do you think this will continue to be the case? Why/why not?
- How have you ensured that you are keeping conditions as close to the required parameters as possible (i.e. maintaining levels of light, temperature, water, nutrients each day)?
- How have the conditions helped or hindered the growth of each radish?
- Are any radishes showing signs of distress or disease? What are they and why do you think they are occurring?
Students continue the radish race until they are able to determine which radishes grew 'best'.
Refer back to the class display created in Lesson 2, where data about the physical conditions about different places in a habitat was collected. Discuss the conditions and how/why they might have changed since the survey was conducted. For example, the ground might be more/less moist based on recent rainfall or lack thereof.
- What was the hottest place/spot in the environment we surveyed? What data tells you this?
- Which place got the most light?
- If we went back and did the survey today, do you think the data would be the same? Why or why not?
- Do you think the overall trend would be the same? Would the place that was the hottest still be the hottest, even if the temperature at that spot was lower than it was on the day we did the initial survey?
- Looking at the place that was the hottest, what do you think would happen if a big, bushy tree appeared right next to it? How would the conditions change?
- What evidence can you draw on from other spots surveyed that might support your thinking? Did we survey any places that were shaded? What were the conditions in those spots like?
- What about if we built a metal shade structure over the top of it? Or a glass one? Would the materials used have an effect on the conditions? Why do you think that?
- Does any of the data we collected during our initially surveyed support these ideas (about materials)?
- How might we collect data that tell us if our ideas are correct or incorrect?
- How might a change in the temperature or light conditions change the growth of the plants now underneath the shade?
- What types of things could change the amount of temperature, light or moisture in these areas?
The Inquire phase allows students to cycle progressively and with increasing complexity through the key science ideas related to the core concepts. Each Inquire cycle is divided into three teaching and learning routines that allow students to systematically build their knowledge and skills in science and incorporate this into their current understanding of the world.
When designing a teaching sequence, it is important to consider the knowledge and skills that students will need in the final Act phase. Consider what the students already know and identify the steps that need to be taken to reach the level required. How could you facilitate students’ understanding at each step? What investigations could be designed to build the skills at each step?
Read more about using the LIA FrameworkIdentifying and constructing questions is the creative driver of the inquiry process. It allows students to explore what they know and how they know it. During the Inquire phase of the LIA Framework, the Question routine allows for past activities to be reviewed and to set the scene for the investigation that students will undertake. The use of effective questioning techniques can influence students’ view and interpretation of upcoming content, open them to exploration and link to their current interests and science capital.
When designing a teaching sequence, it is important to spend some time considering the mindset of students at the start of each Inquire phase. What do you want students to be thinking about, what do they already know and what is the best way for them to approach the task? What might tap into their curiosity?
Read more about using the LIA FrameworkChanging conditions
Explain to students that they are going to investigate a different environment—an aquatic environment—in the following investigation. Brainstorm what students think they know about aquatic environments, including but not limited to:
- what/where they are.
- what they are made up of.
- the types of plants and animals that live in them.
- different examples of aquatic environments.
- the conditions of these different examples.
Record students’ ideas in an appropriate manner, for example, a mind map.
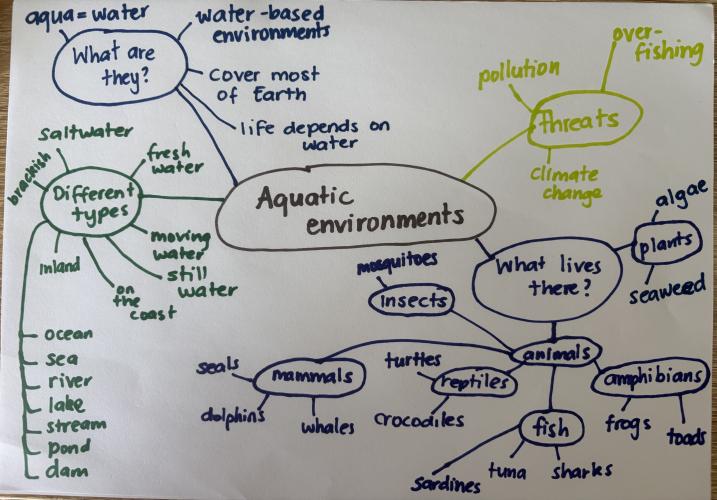
Explain that students will investigate the growing conditions of a small aquatic plant typically found in ponds, wetlands and dams called duckweed.
Show the short video How do you grow duckweed? (1:27) and list the conditions that the narrator says are ideal for growing duckweed: still water, lots of light, lots of nutrients, no predators. Determine which of these factors are “physical conditions” (water, light, chemical nutrients) and which are living things (predators). Explain or draw a diagram that shows the ideal set up. See below for example.
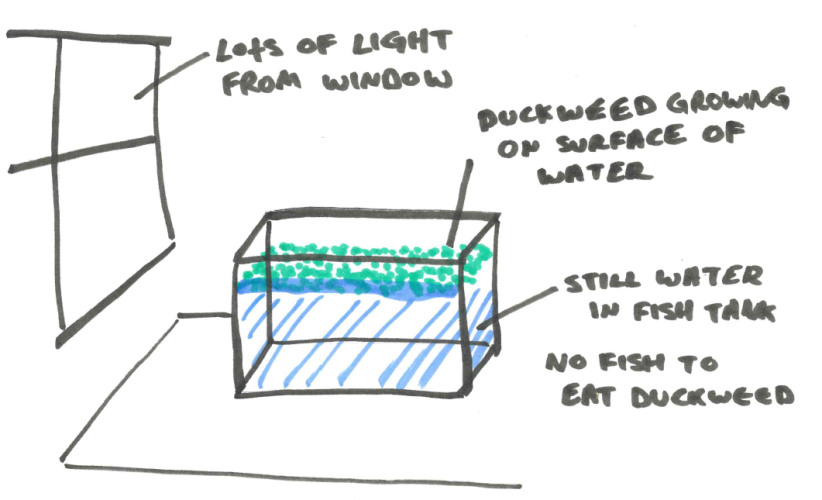
Pose the question: Does changing the physical conditions in an aquatic habitat affect the growth of duckweed? By how much?
Discuss with students the need to take care when working with duckweed, and explain the safety measures that will be used to ensure the duckweed does not escape into local aquatic environments.
All about duckweed
What is duckweed, why are we growing it and how should it be disposed of properly?
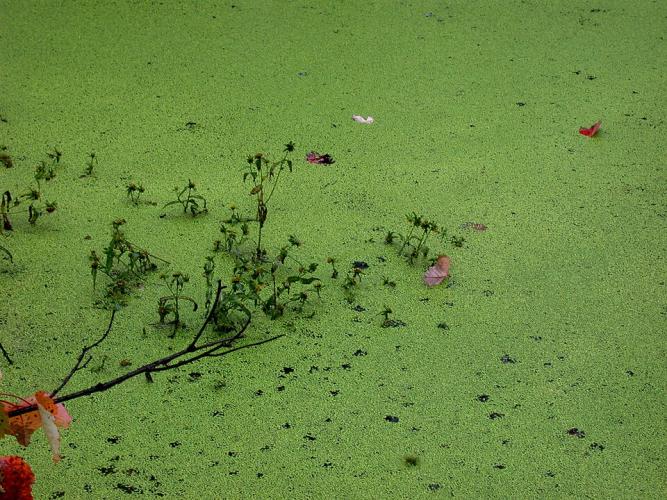
Duckweed is a floating aquatic plant that thrives in slow-moving or still freshwater, growing on the surface of ponds, lakes, and wetlands. Each plant has one, two or three leaves with a root hanging in the water. The roots absorb nutrients such as nitrogen and phosphorus from the water, which can make it useful in ecosystems where there is an excess of these nutrients. It can also be used in wastewater treatment and as a potential high-protein feed for animals such as poultry and fish.
Whilst all referred to as duckweed, there are actually various types. Lemna disperma is native to Australia. Lemna minor and Wolffia arrhiza are not native, but have become naturalised to the environment.
Ideal conditions for growing duckweed
Duckweed thrives best in warm, nutrient-rich freshwater with minimal water movement and plenty of sunlight. Ideal growing conditions typically include temperatures between about 20 to 30°C, a neutral to slightly acidic pH, and calm water surfaces where the plants can remain undisturbed and spread across the surface.
Difficulties caused by duckweed
Despite its small size, duckweed grows extremely quickly, doubling its mass in 16-48 hours when conditions are favourable.
Due to this rapid growth, it has a tendency to totally cover the water’s surface. This drastically reduces the amount of sunlight getting to the water below and depletes oxygen levels. This in turn kills algae and other plants, reducing food and oxygen for fish, turtles and waterfowl, as well as impeding their movement.
For these reasons, care must be taken when washing hands after touching the duckweed during the investigation and when disposing of it afterwards. You need to ensure duckweed is not released into waterways, including stormwater drains, ponds, lakes, or even the wastewater pipes.
Disposing of duckweed correctly
The duckweed growth investigation may take 1-2 weeks. At the end of the investigation, the Duckweed should be disposed of safely.
To dispose of duckweed:
- wear gloves when touching the duckweed and dispose of the gloves in the bin after use.
- use disposable containers and utensils where possible.
- allow non-disposable containers and utensils to dry out completely in the sun for a few days, thus killing any fragments of duckweed.
- do not pour/wash duckweed down sinks or drains as it could potentially enter local waterways.
- collect all duckweed with a net or sieve and place in a container or bag.
- kill the plant material by leaving it in a sealed bag in the sun for a few days, freezing it overnight or letting it completely dry out.
- dispose of it in general waste once it is completely dead.
Remediating duckweed growth if it enters local aquatic environments
If duckweed does enter the local environment, scoop it out with a net and follow the advice above about killing and disposing of it. Monitor local water sources regularly to ensure it is being controlled.
If growth gets out of hand, professional advice should be sought. This is unlikely if you are careful, as described above.
Sourcing duckweed and alternatives
Duckweed is available across most parts of Australia. It can be found naturally in slow-moving water, as well as in plant nurseries and aquarium stores.
As a native species, it is preferred that Lemna disperma is used in this investigation. However Lemna minor and Wolffia arrhiza can also be used if they are disposed of correctly.
When sourcing duckweed, take care not to inadvertently use more invasive species' such as Salvinia minima (sometimes referred to as water spangles), Salvinia molesta (giant salvinia), or Limnobium laevigatum (Amazon frogbit). These are considered highly invasive weeds in Australia, and whilst their sale is illegal, they can sometimes be mislabelled or sold on less regulated websites and marketplaces.
So why bother growing duckweed if it’s such a potential problem?
By Year 6, most students would have a strong understanding that many plants grow in soil. They will have learned about it in previous years and seen evidence in their daily lives. If asking a student what a plant needs to grow, a typical response would be soil, water and sunlight.
However, whilst they may have seen plants growing on the surface of water, they may not have made the explicit link that some of these plants do not grow in soil at all. Learning about the ideal conditions for different species of plants broadens their thinking about the specific physical conditions required for different species.
Duckweed is a floating aquatic plant that thrives in slow-moving or still freshwater, growing on the surface of ponds, lakes, and wetlands. Each plant has one, two or three leaves with a root hanging in the water. The roots absorb nutrients such as nitrogen and phosphorus from the water, which can make it useful in ecosystems where there is an excess of these nutrients. It can also be used in wastewater treatment and as a potential high-protein feed for animals such as poultry and fish.
Whilst all referred to as duckweed, there are actually various types. Lemna disperma is native to Australia. Lemna minor and Wolffia arrhiza are not native, but have become naturalised to the environment.
Ideal conditions for growing duckweed
Duckweed thrives best in warm, nutrient-rich freshwater with minimal water movement and plenty of sunlight. Ideal growing conditions typically include temperatures between about 20 to 30°C, a neutral to slightly acidic pH, and calm water surfaces where the plants can remain undisturbed and spread across the surface.
Difficulties caused by duckweed
Despite its small size, duckweed grows extremely quickly, doubling its mass in 16-48 hours when conditions are favourable.
Due to this rapid growth, it has a tendency to totally cover the water’s surface. This drastically reduces the amount of sunlight getting to the water below and depletes oxygen levels. This in turn kills algae and other plants, reducing food and oxygen for fish, turtles and waterfowl, as well as impeding their movement.
For these reasons, care must be taken when washing hands after touching the duckweed during the investigation and when disposing of it afterwards. You need to ensure duckweed is not released into waterways, including stormwater drains, ponds, lakes, or even the wastewater pipes.
Disposing of duckweed correctly
The duckweed growth investigation may take 1-2 weeks. At the end of the investigation, the Duckweed should be disposed of safely.
To dispose of duckweed:
- wear gloves when touching the duckweed and dispose of the gloves in the bin after use.
- use disposable containers and utensils where possible.
- allow non-disposable containers and utensils to dry out completely in the sun for a few days, thus killing any fragments of duckweed.
- do not pour/wash duckweed down sinks or drains as it could potentially enter local waterways.
- collect all duckweed with a net or sieve and place in a container or bag.
- kill the plant material by leaving it in a sealed bag in the sun for a few days, freezing it overnight or letting it completely dry out.
- dispose of it in general waste once it is completely dead.
Remediating duckweed growth if it enters local aquatic environments
If duckweed does enter the local environment, scoop it out with a net and follow the advice above about killing and disposing of it. Monitor local water sources regularly to ensure it is being controlled.
If growth gets out of hand, professional advice should be sought. This is unlikely if you are careful, as described above.
Sourcing duckweed and alternatives
Duckweed is available across most parts of Australia. It can be found naturally in slow-moving water, as well as in plant nurseries and aquarium stores.
As a native species, it is preferred that Lemna disperma is used in this investigation. However Lemna minor and Wolffia arrhiza can also be used if they are disposed of correctly.
When sourcing duckweed, take care not to inadvertently use more invasive species' such as Salvinia minima (sometimes referred to as water spangles), Salvinia molesta (giant salvinia), or Limnobium laevigatum (Amazon frogbit). These are considered highly invasive weeds in Australia, and whilst their sale is illegal, they can sometimes be mislabelled or sold on less regulated websites and marketplaces.
So why bother growing duckweed if it’s such a potential problem?
By Year 6, most students would have a strong understanding that many plants grow in soil. They will have learned about it in previous years and seen evidence in their daily lives. If asking a student what a plant needs to grow, a typical response would be soil, water and sunlight.
However, whilst they may have seen plants growing on the surface of water, they may not have made the explicit link that some of these plants do not grow in soil at all. Learning about the ideal conditions for different species of plants broadens their thinking about the specific physical conditions required for different species.
The Inquire phase allows students to cycle progressively and with increasing complexity through the key science ideas related to the core concepts. Each Inquire cycle is divided into three teaching and learning routines that allow students to systematically build their knowledge and skills in science and incorporate this into their current understanding of the world.
When designing a teaching sequence, it is important to consider the knowledge and skills that students will need in the final Act phase. Consider what the students already know and identify the steps that need to be taken to reach the level required. How could you facilitate students’ understanding at each step? What investigations could be designed to build the skills at each step?
Read more about using the LIA FrameworkThe Investigate routine provides students with an opportunity to explore the key ideas of science, to plan and conduct an investigation, and to gather and record data. The investigations are designed to systematically develop content knowledge and skills through increasingly complex processes of structured inquiry, guided inquiry and open inquiry approaches. Students are encouraged to process data to identify trends and patterns and link them to the real-world context of the teaching sequence.
When designing a teaching sequence, consider the diagnostic assessment (Launch phase) that identified the alternative conceptions that students held. Are there activities that challenge these ideas and provide openings for discussion? What content knowledge and skills do students need to be able to complete the final (Act phase) task? How could you systematically build these through the investigation routines? Are there opportunities to build students’ understanding and skills in the science inquiry processes through the successive investigations?
Read more about using the LIA FrameworkDuck in a cup
Show students the duckweed and discuss the visible features of the plant, such as leaf size, roots, colour. Explain that the roots of duckweed are very fragile and the plants need to be handled with great care.
Explain that students will conduct a fair test in order to observe the effect that changing one of the physical conditions has on the growth of duckweed.
Optional: If needed, discuss fair testing principles, including why it is essential to only change one variable and leave everything else the same: to ensure that we find out the impact changing a specific variable has on the outcome. If multiple variables are changed, there is no way of knowing which one made the impact and to what degree.
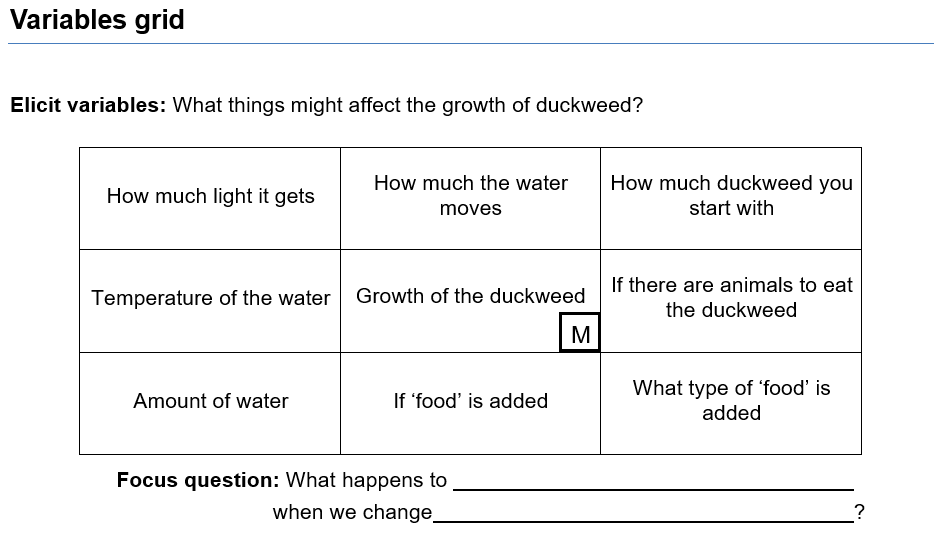
Using a demonstration copy of the Variables grid Resource sheet, draw students’ attention to what will be measured in this investigation—the growth of the duckweed—and add it to the centre of the variables grid marked with an M.
Discuss and determine criteria for how growth data will be determined. For example:
- by observation.
- by measurement, which could include:
- measuring the width and thickness of the duckweed.
- weighing the duckweed after a specific period of growth.
- counting leaf numbers.
- estimating/determining the percentage of the water surface covered by duckweed.
- any combination of these methods.
Next, brainstorm the factors/variables that might affect the growth of duckweed. These might include the starting number of duckweed leaves, amount of water, amount of sunlight, the temperature of the water, the size of the cup, etc. Add these and other variables to the other cells in the variables grid.
Use these variables to determine what a controlled sample of duckweed might look like. For example:
- ten fronds of duckweed placed inside a 250 ml plastic cup/jar with 150 ml of room temperature water.
- nothing added to the water in terms of nutrients.
- still water, no movement at all.
- placed on a specific windowsill for light level and temperature control (as much as is possible).
Discuss what the investigation would look like if each of these variables changed, and how likely they would be to affect the growth of the duckweed. For example, you might use a larger cup (500 ml), but you would still need to use the same amount of water (150 ml). This might also change the depth of the water, depending on the diameter of the cup/jar, so the test may not be fair anymore.
Determine which variables are easiest to change and are likely to have the biggest impact, and are therefore worth testing. Refer back to the ideal conditions for growing duckweed from earlier in the lesson. Discuss what these changes might look like (for example, you might add fish food, milk or leaf litter to a sample as a way of adding nutrients).
TEACHER NOTE: The variables that are likely to make the biggest impact include nutrients added to the water, the movement of the water and the amount of light the plant receives.
Model how to use the question stem to write a question for the investigation: What happens to (the growth of duckweed over time) when we change (insert single variable to be changed)?
Set up the controlled sample of duckweed. You might set up one control sample for the class, or allow each group to grow and monitor their own control sample.
Next, allow teams time to plan their investigation with the changed variable. Depending on the experience of the students with fair tests, and the availability of resources, you may choose to have:
- the whole class investigating the same variable (for example, all groups stir their sample each day). The class will be able to compare the data.
- each student group investigating different variables (for example, two groups stir their sample, two groups add fish food to their sample, two groups add leaves to their sample and two groups put their samples in a dark cupboard). The class will be able to discuss multiple physical conditions.
In collaborative teams, students set up their investigation and begin recording their data on Duckweed investigation planner Resource sheet.
Students collect data on the growth of both duckweed samples (the controlled sample and the varied sample) over a period of 1-2 weeks.
Using a variables grid to plan a fair test investigation
How might you support students to conduct an accurate fair test investigation, with a clear investigable question?
All scientific fair tests involve variables. Variables are things that can be changed (independent), measured/observed (dependent) or kept the same (controlled) in an investigation.
When planning a fair test investigation, to make it a fair, we need to identify the variables. A variables grid can be used to record the identified variables. We then use these variables to turn a broad question, such as “What affects plant growth?” into an investigable one, such as “What happens to the growth of a plant when I change how much water it gets?”.
Investigable questions are characterised by their clear identification of what is being changed and what outcome is being measured in a fair test, supporting students to investigate a specific physical phenomenon.
Investigable questions enable students to plan a fair test investigation. The question they have devised can be answered empirically, and data can be collected to support and justify claims made.
By planning for and conducting a fair test, students can make claims about how the variable they have changed in their investigation may have affected what is being measured and/or observed.
To support students to identify variables, and to use those variables to inform their planning of a fair test, we suggest this handy mnemonic: “Cows Moo Softly”. This helps students remember the letters C, M and S, representing the three types of variables in a fair test:
- Cows: Change one thing (independent variable)
- Moo: Measure/Observe the outcome (dependent variable) and
- Softly: Keep the other things (controlled variables) the Same
The Inquire phase allows students to cycle progressively and with increasing complexity through the key science ideas related to the core concepts. Each Inquire cycle is divided into three teaching and learning routines that allow students to systematically build their knowledge and skills in science and incorporate this into their current understanding of the world.
When designing a teaching sequence, it is important to consider the knowledge and skills that students will need in the final Act phase. Consider what the students already know and identify the steps that need to be taken to reach the level required. How could you facilitate students’ understanding at each step? What investigations could be designed to build the skills at each step?
Read more about using the LIA FrameworkFollowing an investigation, the Integrate routine provides time and space for data to be evaluated and insights to be synthesized. It reveals new insights, consolidates and refines representations, generalises context and broadens students’ perspectives. It allows student thinking to become visible and opens formative feedback opportunities. It may also lead to further questions being asked, allowing the Inquire phase to start again.
When designing a teaching sequence, consider the diagnostic assessment that was undertaken during the Launch phase. Consider if alternative conceptions could be used as a jumping off point to discussions. How could students represent their learning in a way that would support formative feedback opportunities? Could small summative assessment occur at different stages in the teaching sequence?
Read more about using the LIA FrameworkGraphing growth
In the following Integrate routine, students are guided to link their experiences on a micro level growing duckweed with the science on a macro level, that is, that changing physical conditions can affect the growth of a species, and that not all species, specifically plants, need to same conditions for successful growth. Through modelling, questioning and discussion, students should come to a consensus that:
|
Students collect data daily for 1-2 weeks. Return to complete this Integrate routine when sufficient data is recorded.
Discuss the duckweed growth compared to initial growth predictions.
- How many leaves are there now compared to how many you started with?
- Do the growth results match your predictions?
- What percentage of surface area is covered by duckweed now? (or reference any other agreed measurements)
Students represent the data collected in a graph. Guide students on how to generate a line graph (to represent percentage of surface covered) or a column graph (to represent number of leaves) as required, and allow them time to do so either individually or in teams. See the embedded professional learning Graphs below for more advice on creating line graphs.
Use the graphs to analyse and compare data, looking for patterns and relationships.
- What is the story of the graph?
- Which physical condition supported the most growth?
- Was that what you predicted?
- Was your test fair? Why/why not?
- How is this similar to changes in real habitats?
Use sentence scaffolds such as those below to scaffold students as required.
- In moving water, the number of duckweed leaves (increase/decrease; grow faster/slower) over ten days.
- When the water was still, the number of duckweed leaves (….) over ten days.
- When nutrients were added to the water (fish food), duckweed leaves (….) over ten days.
Ask students if they agree with the claim “Changing the conditions that duckweed grows in affects its growth” and why/why not.
Determine if students think there would be specific conditions that would grow the duckweed most effectively, based on the results of the investigations. For example the best conditions could be in still water, placed on the windowsill for light/heat, and with fish food added.
Refer back to Lesson 1 when students identified what plants needed to grow (as they were preparing for the radish race). Discuss how duckweed, whilst still a plant, has different growing needs compared to other plants: duckweed does not grow in soil and instead draws in nutrients that are dissolved in the water. Other plants draw their nutrients from the soil. While plants photosynthesise to get their energy, all plants still require extra nutrients.
Ask if students know about any other types of plants that do not rely on drawing nutrients from the soil (students may have learned about carnivorous plants in the Year 5 sequence Adapt to survive).
Show the video Duckweed, the good the bad and the ugly (4:38) and discuss whether it is helpful or harmful to have duckweed in aquariums and natural habitats such as lakes.
- What are the potential pros and cons of growing duckweed?
- How can changes to the landscape (human-made or natural) affect the growth of duckweed?
- Can other plants grow underneath duckweed? Why or why not?
- What would happen to the duckweed in a pond/dam if extra soil and nutrients washed into it?
- How would tall buildings around a pond affect light levels? How would this affect duckweed growth?
- What happens to the water levels in a pond/dam during a drought? How would this affect duckweed in the dam?
- Do drains/dams/ponds make water move more quickly or slowly through the landscape? How would this affect duckweed growth?
- Duckweed prefers still or slow-moving water common in ponds and dams, whereas drains often move the water away faster.
- In a pond that has been overgrown with duckweed, what could be done to reduce the population and allow other water plants to receive more light?
- Installing a pump/fountain to create water movement would make it difficult for duckweed to survive in that area.
- How can we dispose of duckweed safely so that it doesn't become an environmental nuisance? Do you think it is safe to wash into sinks and drains? Why/why not?
Determine with students what they have learned on a micro level about the physical conditions duckweed requires for growth, and how it might apply from a macro perspective (what general physical conditions all plants might need). Record these in the class science journal.
Reflect on the lesson
You might:
- invite students to evaluate the investigation by recording the challenges faced during the investigation and how they could improve the investigation for fairness (last section of the Duckweed investigation planner Resource sheet).
- add to the class word wall or glossary any relevant words and images related to aquatic plants, duckweed growth, conditions affecting growth.
- add to the L and H sections of the TWLH chart.
Reminder—duckweed disposal
Please dispose of duckweed according to the advice provided in the Preparing for this sequence tab. Duckweed is a fast-growing aquatic plant with the potential to become a nuisance plant in the environment, causing negative impacts on aquatic ecosystems. It must be disposed of correctly.
Graphs
A line graph is used to show how data changes over time and helps students to recognise patterns and trends in a clear visual format.
Line graphs
A line graph is used to show how data changes over time or to display relationships between variables. It helps students recognise patterns and trends in a clear visual format.
Line graphs should be used when the variables are continuous. For example, the percentage of the water surface that is covered can be broken into continuously smaller intervals.
In contrast, the number of leaves is not a continuous variable as $\frac{1}{2}$ leaves or $\frac{3}{4}$ leaves cannot be observed or measured. To represent this sort of data, where one of the variables is described in categories, a column graph is used.
The horizontal axis of a line graph represents the independent variable (the variable that is changed) and the vertical axis represents the dependent variable (the outcome variable that is measured).
Both axes must be clearly labelled, including the correct units of measurement. Students should mark numbers along each axis using an even scale, ensuring the numbers are placed on the lines and are easy to read.
Once the axes are prepared, students plot the data points accurately according to their values. After all points are plotted, they are joined with straight lines to show the trend in the data over time.
Finally, students should include a clear and descriptive title that explains what the graph is showing.
In this specific investigation each cup of growing duckweed is considered its own separate investigation, and each cup experiences the same conditions every day—that is, having nothing done to it in the case of the controlled sample, and (for example) being stirred for the other sample.
This means that the independent variable (the thing that is changed) is the amount of time that has elapsed since the duckweed was “planted”, and the dependent variable (what is measured) is the growth of duckweed over time, represented as a percentage of water surface covered.
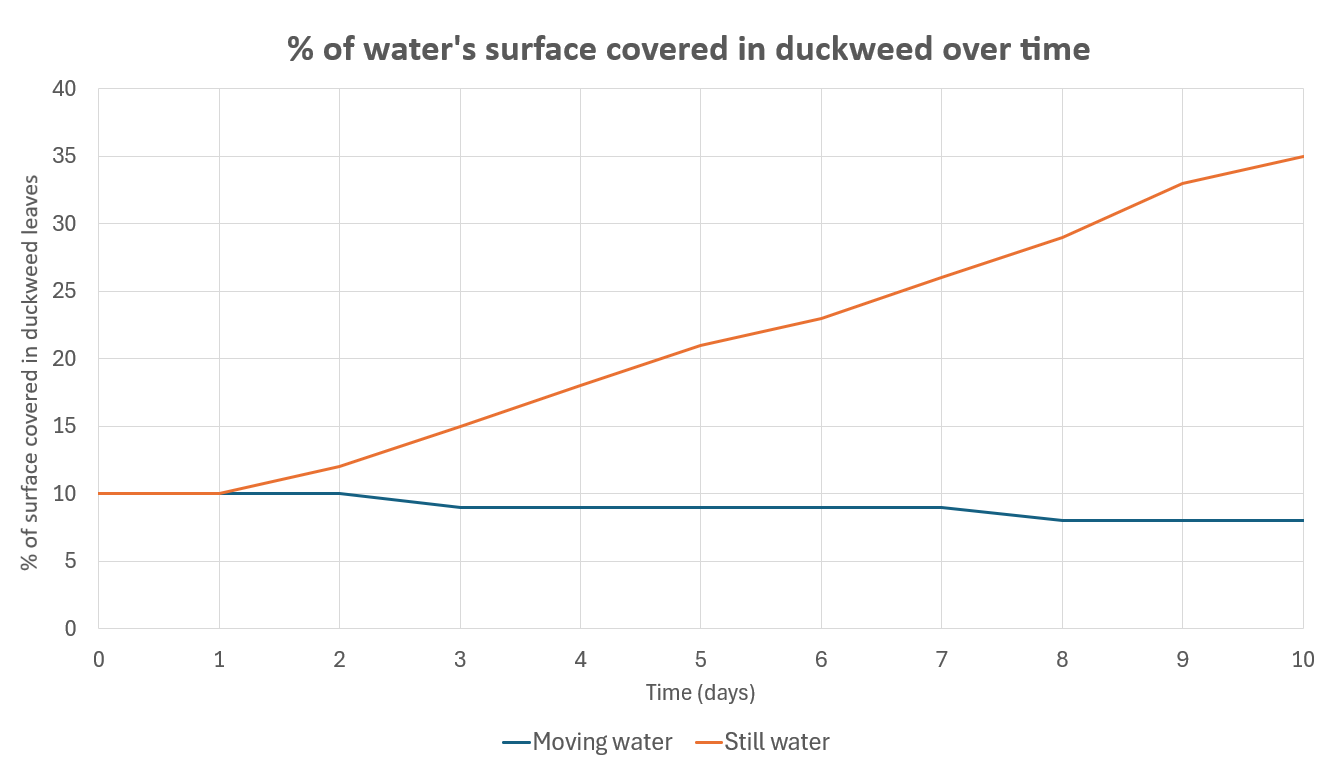
How each sample changed, i.e. the growth it showed over time, is then compared, thus determining which conditions are better suited to duckweed growth. To do this, two coloured lines are plotted on the same graph (one for the controlled sample and one for teams’ varied sample) so that students are able to see the difference in the growth of duckweed over time. A key should be included to distinguish which colour represents which sample.
For example, in the image above, the difference of growth of the duckweed over time in moving water and still water is represented by blue and orange lines respectively. It shows that duckweed grows more successfully in still water.
Common errors
A common error is confusing the independent and dependent variables. Students may place the measured variable on the horizontal axis instead of the vertical axis, or vice versa, rather than recognising that the independent variable (what is changed) belongs on the horizontal axis and the dependent variable (what is measured) on the vertical axis.
Another issue is incorrect or inconsistent scaling. Students may not space numbers evenly, skip values irregularly, or choose a scale that does not fit the data well, making the graph difficult to interpret.
Students may also forget to label the axes or omit units of measurement, which limits the usefulness and clarity of the graph. Some may place numbers between lines rather than on the lines, or not align them correctly.
Plotting errors are also common. Students might plot points inaccurately, reverse coordinates, or fail to align points with both axes correctly. In some cases, they may connect points incorrectly, such as drawing separate lines for each point, not using a ruler, or incorrectly joining points when a continuous line is needed.
Finally, students may overlook the importance of a clear title or misunderstand what the graph represents, focusing only on drawing rather than interpreting the data and identifying trends.
Addressing these errors explicitly can improve students’ accuracy and deepen their understanding of how graphs represent and communicate information.
Line graphs
A line graph is used to show how data changes over time or to display relationships between variables. It helps students recognise patterns and trends in a clear visual format.
Line graphs should be used when the variables are continuous. For example, the percentage of the water surface that is covered can be broken into continuously smaller intervals.
In contrast, the number of leaves is not a continuous variable as $\frac{1}{2}$ leaves or $\frac{3}{4}$ leaves cannot be observed or measured. To represent this sort of data, where one of the variables is described in categories, a column graph is used.
The horizontal axis of a line graph represents the independent variable (the variable that is changed) and the vertical axis represents the dependent variable (the outcome variable that is measured).
Both axes must be clearly labelled, including the correct units of measurement. Students should mark numbers along each axis using an even scale, ensuring the numbers are placed on the lines and are easy to read.
Once the axes are prepared, students plot the data points accurately according to their values. After all points are plotted, they are joined with straight lines to show the trend in the data over time.
Finally, students should include a clear and descriptive title that explains what the graph is showing.
In this specific investigation each cup of growing duckweed is considered its own separate investigation, and each cup experiences the same conditions every day—that is, having nothing done to it in the case of the controlled sample, and (for example) being stirred for the other sample.
This means that the independent variable (the thing that is changed) is the amount of time that has elapsed since the duckweed was “planted”, and the dependent variable (what is measured) is the growth of duckweed over time, represented as a percentage of water surface covered.
How each sample changed, i.e. the growth it showed over time, is then compared, thus determining which conditions are better suited to duckweed growth. To do this, two coloured lines are plotted on the same graph (one for the controlled sample and one for teams’ varied sample) so that students are able to see the difference in the growth of duckweed over time. A key should be included to distinguish which colour represents which sample.
For example, in the image above, the difference of growth of the duckweed over time in moving water and still water is represented by blue and orange lines respectively. It shows that duckweed grows more successfully in still water.
Common errors
A common error is confusing the independent and dependent variables. Students may place the measured variable on the horizontal axis instead of the vertical axis, or vice versa, rather than recognising that the independent variable (what is changed) belongs on the horizontal axis and the dependent variable (what is measured) on the vertical axis.
Another issue is incorrect or inconsistent scaling. Students may not space numbers evenly, skip values irregularly, or choose a scale that does not fit the data well, making the graph difficult to interpret.
Students may also forget to label the axes or omit units of measurement, which limits the usefulness and clarity of the graph. Some may place numbers between lines rather than on the lines, or not align them correctly.
Plotting errors are also common. Students might plot points inaccurately, reverse coordinates, or fail to align points with both axes correctly. In some cases, they may connect points incorrectly, such as drawing separate lines for each point, not using a ruler, or incorrectly joining points when a continuous line is needed.
Finally, students may overlook the importance of a clear title or misunderstand what the graph represents, focusing only on drawing rather than interpreting the data and identifying trends.
Addressing these errors explicitly can improve students’ accuracy and deepen their understanding of how graphs represent and communicate information.