

What‘s great for growth?
View Sequence overviewStudents will:
- measure temperature, light and moisture conditions in the survey area.
- compare satellite images to identify changes that would impact the physical conditions in the school (or local environment).
- recognise that physical conditions in habitats may change rapidly or gradually.
Students will represent their understanding as they:
- use a table to record survey information.
- predict with reasoning how the observable differences in the satellite images directly or indirectly affect physical conditions.
- optional: create a labelled diagram to explain how the observed changes may affect the survival of the local endangered species.
In this lesson, assessment is formative.
Feedback might focus on:
- the accuracy of data students collected.
- the comparisons students draw between the first and second data collections.
- their reasoning for why the data may have changed.
- their conclusions for how local species cope with this change.
Whole class
Class science journal (digital or hard-copy)
Thermometer or digital temperature sensor
Clipboard
Pen/pencil
Tablet or device with light meter app (optional)
Soil moisture meter (optional)
Camera (optional)
Each student
Individual science journal (digital or hard-copy)
Condition survey Resource sheet
Lesson
The Inquire phase allows students to cycle progressively and with increasing complexity through the key science ideas related to the core concepts. Each Inquire cycle is divided into three teaching and learning routines that allow students to systematically build their knowledge and skills in science and incorporate this into their current understanding of the world.
When designing a teaching sequence, it is important to consider the knowledge and skills that students will need in the final Act phase. Consider what the students already know and identify the steps that need to be taken to reach the level required. How could you facilitate students’ understanding at each step? What investigations could be designed to build the skills at each step?
Read more about using the LIA FrameworkRe-orient
Recall the previous lesson, focussing on the growing conditions for mould and other types of fungi. If required, allow time for students to make further mouldy bread observations (without opening the bags).
The Inquire phase allows students to cycle progressively and with increasing complexity through the key science ideas related to the core concepts. Each Inquire cycle is divided into three teaching and learning routines that allow students to systematically build their knowledge and skills in science and incorporate this into their current understanding of the world.
When designing a teaching sequence, it is important to consider the knowledge and skills that students will need in the final Act phase. Consider what the students already know and identify the steps that need to be taken to reach the level required. How could you facilitate students’ understanding at each step? What investigations could be designed to build the skills at each step?
Read more about using the LIA FrameworkIdentifying and constructing questions is the creative driver of the inquiry process. It allows students to explore what they know and how they know it. During the Inquire phase of the LIA Framework, the Question routine allows for past activities to be reviewed and to set the scene for the investigation that students will undertake. The use of effective questioning techniques can influence students’ view and interpretation of upcoming content, open them to exploration and link to their current interests and science capital.
When designing a teaching sequence, it is important to spend some time considering the mindset of students at the start of each Inquire phase. What do you want students to be thinking about, what do they already know and what is the best way for them to approach the task? What might tap into their curiosity?
Read more about using the LIA FrameworkChanging conditions
Review the results of the radish race at the beginning of the sequence. Discuss the different locations that the plants were placed and whether conditions in each location changed over the growing period. Discuss the different timescales of the changes, for example, over a day, a week, a month.
- Where did we place our plants while they were growing?
- Why did we choose those locations?
- Did the conditions in those locations change over the time the radishes were growing there?
- How did they change?
- Did the temperature, light or moisture conditions change in any way?
- How/why do you think those conditions changed?
- Was there a sudden cold snap, an unexpected rain event etc.?
- How long did it take until these changes were noticeable?
- Over what period of time did the conditions change?
- Was it cloudy for a few days but sunny the rest of the time?
- Was a tree suddenly removed and more light flooded the spot?
- Did the change take place slowly and change a bit as the seasons changed?
Pose the question: Do you think the environment we surveyed in Lesson 2 has changed in the last ___ weeks?
The Inquire phase allows students to cycle progressively and with increasing complexity through the key science ideas related to the core concepts. Each Inquire cycle is divided into three teaching and learning routines that allow students to systematically build their knowledge and skills in science and incorporate this into their current understanding of the world.
When designing a teaching sequence, it is important to consider the knowledge and skills that students will need in the final Act phase. Consider what the students already know and identify the steps that need to be taken to reach the level required. How could you facilitate students’ understanding at each step? What investigations could be designed to build the skills at each step?
Read more about using the LIA FrameworkThe Investigate routine provides students with an opportunity to explore the key ideas of science, to plan and conduct an investigation, and to gather and record data. The investigations are designed to systematically develop content knowledge and skills through increasingly complex processes of structured inquiry, guided inquiry and open inquiry approaches. Students are encouraged to process data to identify trends and patterns and link them to the real-world context of the teaching sequence.
When designing a teaching sequence, consider the diagnostic assessment (Launch phase) that identified the alternative conceptions that students held. Are there activities that challenge these ideas and provide openings for discussion? What content knowledge and skills do students need to be able to complete the final (Act phase) task? How could you systematically build these through the investigation routines? Are there opportunities to build students’ understanding and skills in the science inquiry processes through the successive investigations?
Read more about using the LIA FrameworkWhat causes changes to conditions?
Use the class display that was created in Lesson 2 to review the habitat that was visited and the results of the survey of the physical environment including temperature, light and moisture.
Discuss the types of things that may have occurred since the survey was carried out, such as:
- changes in the weather (rain, heat or frosts).
- building or road works, flooding.
- large numbers of students playing in the area.
Revisit the original survey area and re-take the data at each location originally visited. Students can review their Condition survey Resource to remind themselves of the locations they visited. If required, remind students of how to take the measurements. Record results on a new copy of the Condition survey resource sheet.
The Inquire phase allows students to cycle progressively and with increasing complexity through the key science ideas related to the core concepts. Each Inquire cycle is divided into three teaching and learning routines that allow students to systematically build their knowledge and skills in science and incorporate this into their current understanding of the world.
When designing a teaching sequence, it is important to consider the knowledge and skills that students will need in the final Act phase. Consider what the students already know and identify the steps that need to be taken to reach the level required. How could you facilitate students’ understanding at each step? What investigations could be designed to build the skills at each step?
Read more about using the LIA FrameworkFollowing an investigation, the Integrate routine provides time and space for data to be evaluated and insights to be synthesized. It reveals new insights, consolidates and refines representations, generalises context and broadens students’ perspectives. It allows student thinking to become visible and opens formative feedback opportunities. It may also lead to further questions being asked, allowing the Inquire phase to start again.
When designing a teaching sequence, consider the diagnostic assessment that was undertaken during the Launch phase. Consider if alternative conceptions could be used as a jumping off point to discussions. How could students represent their learning in a way that would support formative feedback opportunities? Could small summative assessment occur at different stages in the teaching sequence?
Read more about using the LIA FrameworkThe cause of change
In the following Integrate routine, students are guided to link their experiences on a micro level re-surveying the conditions of a habitat with the science at a macro level, that is, that the physical conditions of a habitat change over time due to a number of factors. Through modelling, questioning and discussion, students should come to a consensus that:
|
Compare and discuss the data from the two surveys, identifying any changes that have occurred over the previous weeks.
- What is the most noticeable change you see compared to last time?
- What has stayed the same, and why do you think that is?
- Are there any new plants, animals, or signs of life you didn’t notice before?
- What do you think caused these changes (weather, seasons, or human activity)?
- How might recent events (rain, heat, construction etc.) have influenced what you see?
- How quickly did these changes occur? Were they sudden, or did they take time?
- Could any of these changes be temporary or seasonal? Do you think conditions will return to what they were like when we originally surveyed? Why/why not?
- How might these changes affect local wildlife or plant life? Do you think they will cope well with the change? Why/why not?
Discuss changes that have occurred in the school and local environment since students have been there.
- Are there any new buildings, paths or play areas?
- Have any new trees been planted, or old trees cut down?
- Which changes do you think are natural, and which might be caused by people?
- Do you think people are helping or harming this environment? What makes you think that?
- What could people do to improve the area?
- What questions do you still have about this environment?
Ask students what they already know about the local area, any changes they know have happened recently or are happening now, and what they think may have changed over a longer timeframe.
As a class, use historical images and maps to explore how a local environment has changed over time.
There are several tools to support this, including Google Maps and Google Earth. See the embedded professional learning Using digital tools to survey the local area below for more detailed information on how to use these tools, as well as state-specific databases of aerial photographs (where available).
Examine and discuss the images of your local area.
Ask students to explain, with reasoning, how the changes they have observed could affect the physical conditions in the environment. If required, give an example: new roads and solid surfaces absorb more heat compared to most natural surfaces, causing an increase in temperature. They also do not absorb water, which leads to greater/faster water runoff into other places.
- What has changed between the images? How does the environment, both natural and man-made, look different?
- Do you think these changes are permanent or temporary? Why do you think that?
- How has the colour of the landscape changed in the images? Looking at the dates, could this be because of seasonal differences?
- How would this carpark/roadway affect the soil’s ability to absorb water?
- How would these new/removed trees affect the levels of light in the environment?
- What living things are likely to thrive in the changed environment? Which ones will struggle?
Determine with students what they have learned on a micro level and how it might apply from a macro perspective. Record these in the class science journal. See the step purpose section at the beginning of this step for details that might guide your discussion.
Optional: Show the video How we regenerate Australian landscapes – Leaky Weirs (3:05) to consider how Australian landscapes have changed since European settlement and how changes can be beneficial or harmful for the environment. For example, leaky weirs can be used to restore soil moisture and reduce erosion and nutrient loss.
Optional: Students create labelled “before” and “after” diagrams to explain how an observed change (from the survey or satellite images) may affect the survival of a local species.
Reflect on the lesson
You might:
- discuss how soil moisture might directly or indirectly affect the local endangered species.
- add to the class word wall or glossary any relevant words and images related to changing physical conditions.
- add to the L and H sections of the TWLH chart.
Using digital tools to survey the local area
How do Google Earth and other digital map programs work?
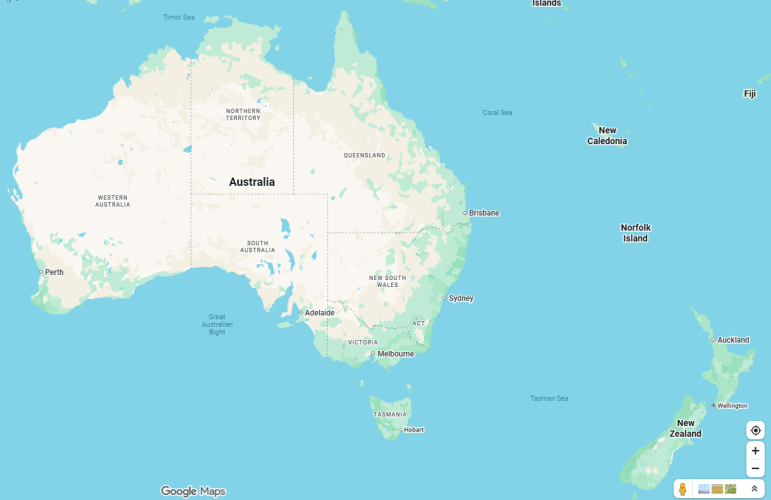
Access to historical images and maps will depend on location and available resources. Local historical societies, regional museums, school and council archives are worth exploring. Alternatively, Google Maps and Google Earth are free online accessible options.
All descriptions of how to use these websites are tailored for a desktop or laptop computer. Functions may be located in a different place on digital devices. Examine your chosen tool/s beforehand to identify the required functions if using a digital device.
Google Maps
Google Maps provides recent satellite images and historical Street View images from 2008 in Australia. These images often show considerable changes to the environment caused by humans, particularly in areas affected by growth and development during that time. Natural changes such as tree growth and seasonal drying of grasses can also be observed.
How to find historical images using Google Maps:
- Type the specifically required location into the search box, located in the top left on a desktop screen, will give you an aerial overview of the area. Use a specific address, a suburb name, or even the name of a whole region, for example, 1100 Horseshoe Bend Rd, Torquay, Victoria.
- Use the Layers feature, located in the bottom left of a desktop screen, to switch between views. Satellite view shows photographic aerial shots. Note that these images may be out of date.
- Use the Street View feature, found in the bottom right on a desktop screen, to see a 360° street-level view of a specific location. Navigate along the roadway using the arrows or by simply tapping or clicking in the direction you'd like to move.
- Select the option “see more dates” found in the top left of the screen in Street View. You can view and compare historical images (back to 2007/2008) at the bottom of the screen.
- Save or share images of a location using the Share icon located in the top right on a desktop screen.
Google Earth
Google Earth provides recent and historical satellite images and a recent street view. Some areas have satellite imagery as far back as the late 1980s, although these earlier images (prior to 2010) are lower resolution compared to more recent images. To access the historical satellite images, select the clock icon in the toolbar and slide the bar, or select “view historical imagery”.
Google Earth may be slower to load than Google Maps.
Historical photographs and maps provide evidence of environmental changes over time, such as tree clearing and the construction of buildings, roads, and dams. Trees provide shade and encourage moisture to be retained in the soil. Scientists found that the street temperature is reduced by 0.1 degrees Celsius for every 10% tree coverage*. Clearing trees contributes to the increase in temperature experienced by living things in the area.
Concrete has a large thermal mass. This means that the concrete roads and buildings absorb and retain heat. This allows water to evaporate from nearby soil surfaces. Replacing trees with concrete can significantly affect the physical conditions experienced by plants, fungi and animals in the area.
Comparing these historical images allows students to examine how a local environment has changed and make inferences about the impact on the survival of living things.
Other websites that contain aerial imagery of Australia over time
The following links contain aerial photographs from across Australia.
- Geoscience Australia’s historical aerial photo explorer contains images from locations across the whole of Australia.
- QImagery
- The NSW Historical Imagery covers metropolitan Sydney.
- MapShare Victoria
- ACTmapi
- LandTasmania’s aerial photo viewer
*Ettinger, A. K., Bratman, G. N., Carey, M., Hebert, R., Hill, O., Kett, H., ... & Wyse, L. (2024). Street trees provide an opportunity to mitigate urban heat and reduce risk of high heat exposure. Scientific Reports, 14(1), 3266.
Access to historical images and maps will depend on location and available resources. Local historical societies, regional museums, school and council archives are worth exploring. Alternatively, Google Maps and Google Earth are free online accessible options.
All descriptions of how to use these websites are tailored for a desktop or laptop computer. Functions may be located in a different place on digital devices. Examine your chosen tool/s beforehand to identify the required functions if using a digital device.
Google Maps
Google Maps provides recent satellite images and historical Street View images from 2008 in Australia. These images often show considerable changes to the environment caused by humans, particularly in areas affected by growth and development during that time. Natural changes such as tree growth and seasonal drying of grasses can also be observed.
How to find historical images using Google Maps:
- Type the specifically required location into the search box, located in the top left on a desktop screen, will give you an aerial overview of the area. Use a specific address, a suburb name, or even the name of a whole region, for example, 1100 Horseshoe Bend Rd, Torquay, Victoria.
- Use the Layers feature, located in the bottom left of a desktop screen, to switch between views. Satellite view shows photographic aerial shots. Note that these images may be out of date.
- Use the Street View feature, found in the bottom right on a desktop screen, to see a 360° street-level view of a specific location. Navigate along the roadway using the arrows or by simply tapping or clicking in the direction you'd like to move.
- Select the option “see more dates” found in the top left of the screen in Street View. You can view and compare historical images (back to 2007/2008) at the bottom of the screen.
- Save or share images of a location using the Share icon located in the top right on a desktop screen.
Google Earth
Google Earth provides recent and historical satellite images and a recent street view. Some areas have satellite imagery as far back as the late 1980s, although these earlier images (prior to 2010) are lower resolution compared to more recent images. To access the historical satellite images, select the clock icon in the toolbar and slide the bar, or select “view historical imagery”.
Google Earth may be slower to load than Google Maps.
Historical photographs and maps provide evidence of environmental changes over time, such as tree clearing and the construction of buildings, roads, and dams. Trees provide shade and encourage moisture to be retained in the soil. Scientists found that the street temperature is reduced by 0.1 degrees Celsius for every 10% tree coverage*. Clearing trees contributes to the increase in temperature experienced by living things in the area.
Concrete has a large thermal mass. This means that the concrete roads and buildings absorb and retain heat. This allows water to evaporate from nearby soil surfaces. Replacing trees with concrete can significantly affect the physical conditions experienced by plants, fungi and animals in the area.
Comparing these historical images allows students to examine how a local environment has changed and make inferences about the impact on the survival of living things.
Other websites that contain aerial imagery of Australia over time
The following links contain aerial photographs from across Australia.
- Geoscience Australia’s historical aerial photo explorer contains images from locations across the whole of Australia.
- QImagery
- The NSW Historical Imagery covers metropolitan Sydney.
- MapShare Victoria
- ACTmapi
- LandTasmania’s aerial photo viewer
*Ettinger, A. K., Bratman, G. N., Carey, M., Hebert, R., Hill, O., Kett, H., ... & Wyse, L. (2024). Street trees provide an opportunity to mitigate urban heat and reduce risk of high heat exposure. Scientific Reports, 14(1), 3266.