Adapt to survive
View Sequence overviewStudents will:
- recognise that habitats provide for the survival/needs of a range of plants and animals.
- identify plants and animals in a survey area.
- examine an animal (or plant) species more closely.
Students will represent their understanding as they:
- use a table to tally survey information.
- create a bar graph using survey data.
- describe how a feature or behaviour of one species helps them to survive.
In this lesson, assessment is formative.
Feedback might focus on:
- students’ habitat survey and bar graph. Have students clearly represented their observations of plant and animal species?
- students’ observations about ants (or another species). Have students identified structures/functions that enable survival? Can they explain how the feature/behaviour enables survival in the habitat? What happens if the habitat changes? Why would a habitat change and what are the consequences for some species?
Whole class
An aerial map/Google Earth/similar which shows a birds-eye view of the school grounds
Class science journal (digital or hard-copy)
Demonstration copy of the Sample habitat survey Resource sheet
Demonstration copy of the Code for caring and hygiene Resource sheet
Demonstration copy of the Ants Resource sheet. Alternatively, see the embedded professional learning Adapting to your context in the Question step of this lesson for guidance on changing the focus of this investigation.
Access to a safe and suitable location in or near the school grounds, to conduct a habitat survey. See the embedded professional learning Habitat survey in the first Investigate step of this lesson.
Each group
Habitat survey Resource sheet
Clipboard
Pen/pencil
Hula hoop, rope or similar to create a defined boundary
Laptop/tablet/digital camera for photographs & videos
Optional: Small container for specimen
Optional: Spoon or damp paint brush for picking up safe specimen
Each student
Individual science journal (digital or hard-copy)
Lesson
The Inquire phase allows students to cycle progressively and with increasing complexity through the key science ideas related to the core concepts. Each Inquire cycle is divided into three teaching and learning routines that allow students to systematically build their knowledge and skills in science and incorporate this into their current understanding of the world.
When designing a teaching sequence, it is important to consider the knowledge and skills that students will need in the final Act phase. Consider what the students already know and identify the steps that need to be taken to reach the level required. How could you facilitate students’ understanding at each step? What investigations could be designed to build the skills at each step?
Read more about using the LIA FrameworkRe-orient
Recall the previous learning, focusing on the different body features that enable animals to survive in their habitats.
The Inquire phase allows students to cycle progressively and with increasing complexity through the key science ideas related to the core concepts. Each Inquire cycle is divided into three teaching and learning routines that allow students to systematically build their knowledge and skills in science and incorporate this into their current understanding of the world.
When designing a teaching sequence, it is important to consider the knowledge and skills that students will need in the final Act phase. Consider what the students already know and identify the steps that need to be taken to reach the level required. How could you facilitate students’ understanding at each step? What investigations could be designed to build the skills at each step?
Read more about using the LIA FrameworkIdentifying and constructing questions is the creative driver of the inquiry process. It allows students to explore what they know and how they know it. During the Inquire phase of the LIA Framework, the Question routine allows for past activities to be reviewed and to set the scene for the investigation that students will undertake. The use of effective questioning techniques can influence students’ view and interpretation of upcoming content, open them to exploration and link to their current interests and science capital.
When designing a teaching sequence, it is important to spend some time considering the mindset of students at the start of each Inquire phase. What do you want students to be thinking about, what do they already know and what is the best way for them to approach the task? What might tap into their curiosity?
Read more about using the LIA FrameworkWhat's around us?
Using an aerial map, Google Earth or similar display a birds-eye view of the school grounds, including buildings, ovals, gardens etc.
Re-visit the term “habitat”: the specific location that an organism visits and where its needs are met. A habitat provides the organisms that live there with food, water, shelter, and enough space to move and survive.
Discuss the types of habitats likely to be found in the school grounds and the plants and animals that might live there. Refer to the aerial map shown to locate these habitats.
- What habitats do we have in/close to our school grounds?
- The answer to this question will depend heavily on your school’s location and context.
- Some schools might have access to wetlands, ponds, and grassland, whereas others in more urban environments may have only access to garden beds, school ovals, etc.
- Some animals have adapted to living in urban environments. Examples include insects (spiders, flies, and black cockroaches), seagulls, and possums.
- Regardless, there will be plant and animal life living in your school grounds for students to study.
- What plants and animals survive in these habitats?
- What challenges do plants and animals face in our school grounds?
- They might get stepped on, have balls hitting them, lawn mowers cutting them, large amounts of sun, loud sounds, etc.
Pose the questions: How can we collect data on plants and animals in the school grounds/local area? What data is needed? How can we ensure the plants and animals remain safe while we collect data?
The Inquire phase allows students to cycle progressively and with increasing complexity through the key science ideas related to the core concepts. Each Inquire cycle is divided into three teaching and learning routines that allow students to systematically build their knowledge and skills in science and incorporate this into their current understanding of the world.
When designing a teaching sequence, it is important to consider the knowledge and skills that students will need in the final Act phase. Consider what the students already know and identify the steps that need to be taken to reach the level required. How could you facilitate students’ understanding at each step? What investigations could be designed to build the skills at each step?
Read more about using the LIA FrameworkThe Investigate routine provides students with an opportunity to explore the key ideas of science, to plan and conduct an investigation, and to gather and record data. The investigations are designed to systematically develop content knowledge and skills through increasingly complex processes of structured inquiry, guided inquiry and open inquiry approaches. Students are encouraged to process data to identify trends and patterns and link them to the real-world context of the teaching sequence.
When designing a teaching sequence, consider the diagnostic assessment (Launch phase) that identified the alternative conceptions that students held. Are there activities that challenge these ideas and provide openings for discussion? What content knowledge and skills do students need to be able to complete the final (Act phase) task? How could you systematically build these through the investigation routines? Are there opportunities to build students’ understanding and skills in the science inquiry processes through the successive investigations?
Read more about using the LIA FrameworkHabitat close up
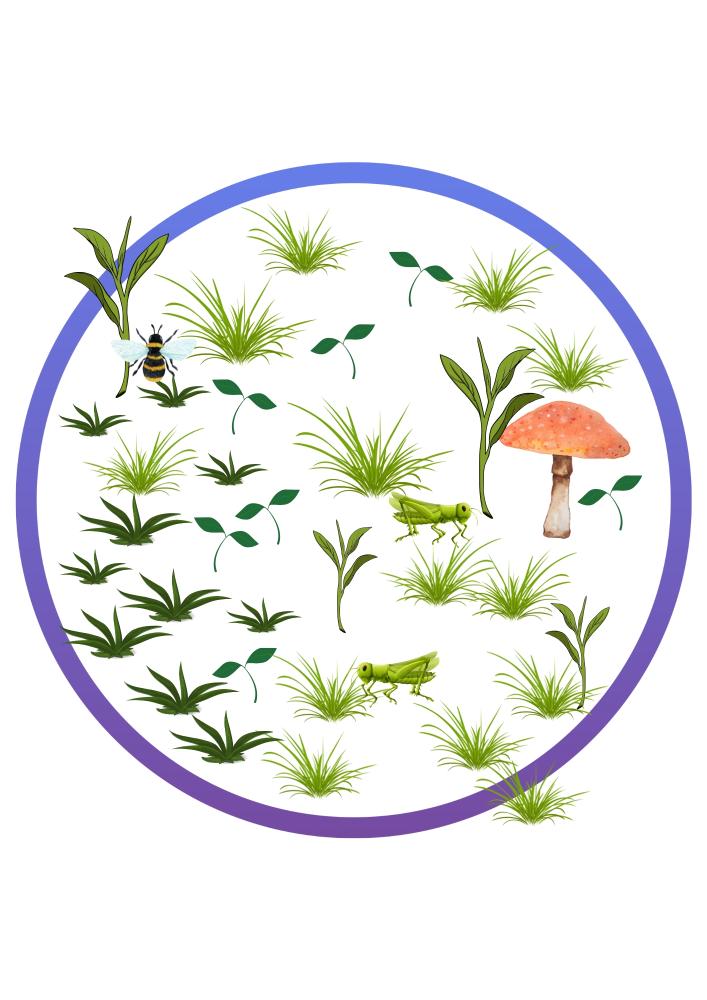
Students survey the plant and animal species within a marked space in a habitat.
Before the habitat survey
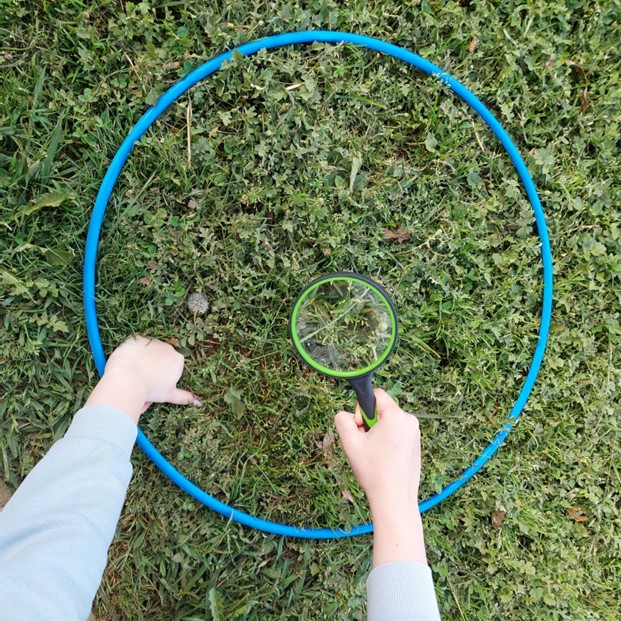
Explain the survey procedure to students: they will identify a specific habitat in or near the school grounds, mark out a confined space using the hula hoop or rope, then carefully collect data on the plant and animal species found within that space.
Define the term “species”: a group of organisms that can naturally interbreed and produce healthy offspring/babies that are also capable of reproducing.
Discuss why scientists survey habitats, the purpose of using the hula hoop/rope, what students think they will find, and the ethics and safety considerations of looking closely at plants and animals in the school grounds.
- Why do you think scientists survey and study habitats?
- To identify the number and type of organisms living there.
- What information might they collect?
- How do you think they record this information?
- Why would we only be studying a small, defined area (i.e. inside the hula hoop) instead of the entire habitat?
- To keep the same size for each survey and help students concentrate on one representative area of the habitat.
- What other equipment (besides the hula hoop) might we use to ensure a successful survey?
- Digital devices for photos/videos, magnifying glasses, small containers for leaf samples/invertebrates, small hand shovel (if appropriate).
- What would we need to consider if we tried to collect data in a larger area?
- What types of plants and animals do you think you will find in our school environment?
- How can you ensure not to harm the plants or animals in and around the area you are surveying?
- How can you ensure that you are not harmed when conducting your survey?
- What hygiene standards might we have to adhere to?
Optional: Create or refer to a class “code for caring and hygiene” that contains the expectations and responsibilities of students whilst undertaking the survey. An example of one can be found on the Code for caring and hygiene Resource sheet, which can be modified as needed to suit your students and context.
Display the Habitat survey Resource sheet and discuss the purpose of the tables—to record information and data about plants and animals.
Using the Sample habitat survey Resource sheet as an example of what might be found during the survey, model how to thoroughly search the specified area and record data of what was found. Focus on:
- how to list plants and animal species when we don’t know their specific name (such as “Grass 1”, “long narrow leaves”).
- the usefulness of taking photos or drawing pictures where needed.
- how to determine what is inside or outside the hoop.
- For example, if the roots are inside the hoop or a part of an animal is in the hoop, then it should be recorded in the survey.
- searching the area methodically (perhaps top to bottom or left to right).
- drawing an identifying feature for each species, where possible.
- mapping where each species existed in the hula hoop habitat.
- whether or not students will collect a specimen to bring back to the classroom.
- how to record the species diversity with individual organism tallies.
During the survey
In teams, allow students time to conduct the survey in a suitable and safe location in or near the school grounds, recording their information on their Habitat survey Resource sheet.
Habitat survey
How might you modify this lesson to include local examples, whilst still gathering useful diagnostic data?
The habitat survey can be adapted to suit your students and local context.
There are often several habitats within a school ground, including the oval or perhaps a mulched space under some trees. It can be surprising how many different grasses, weeds and insects can be found on a school oval. Hula hoops maintain the survey areas to a consistent and comparable size, which assists students in focusing their attention on the relevant plants and animals they would ordinarily overlook. Insects will likely be included in all samples.
Students might all survey the same habitat, near each other, or they might survey multiple habitats around the school grounds. Both options provide an opportunity to collect and compare data on plant and animal structure and function and behaviours.
Alternatively, the survey could be conducted at a local park, wetland, pond or rock pool, adjusting equipment and safety requirements as necessary.
Small invertebrates such as grasshoppers, worms, and slaters can be harmed when they are handled without proper care, instead they should be closely observed and/or photographed/filmed in situ.
The Inquire phase allows students to cycle progressively and with increasing complexity through the key science ideas related to the core concepts. Each Inquire cycle is divided into three teaching and learning routines that allow students to systematically build their knowledge and skills in science and incorporate this into their current understanding of the world.
When designing a teaching sequence, it is important to consider the knowledge and skills that students will need in the final Act phase. Consider what the students already know and identify the steps that need to be taken to reach the level required. How could you facilitate students’ understanding at each step? What investigations could be designed to build the skills at each step?
Read more about using the LIA FrameworkFollowing an investigation, the Integrate routine provides time and space for data to be evaluated and insights to be synthesized. It reveals new insights, consolidates and refines representations, generalises context and broadens students’ perspectives. It allows student thinking to become visible and opens formative feedback opportunities. It may also lead to further questions being asked, allowing the Inquire phase to start again.
When designing a teaching sequence, consider the diagnostic assessment that was undertaken during the Launch phase. Consider if alternative conceptions could be used as a jumping off point to discussions. How could students represent their learning in a way that would support formative feedback opportunities? Could small summative assessment occur at different stages in the teaching sequence?
Read more about using the LIA FrameworkRepresenting the data
In the following Integrate routine, students are guided to link their experiences surveying plant and animal species in the school grounds to the upcoming investigation, where they will look at one of the species they saw in more detail. Through modelling, questioning and discussion, students should come to a consensus that:
|
Discuss any challenges the students faced completing the survey, such as accidentally counting the same plant/animal twice, ants and beetles moving around, or plants growing close together and appearing to be one larger plant.
Ask students to help define the terms “species list” and “population count”, as the terms will be used to create a graph showing the results of the habitat survey:
- Species list: A list of all the different species (plants and animals) present.
- Population count: The number of individual organisms of one specific species.
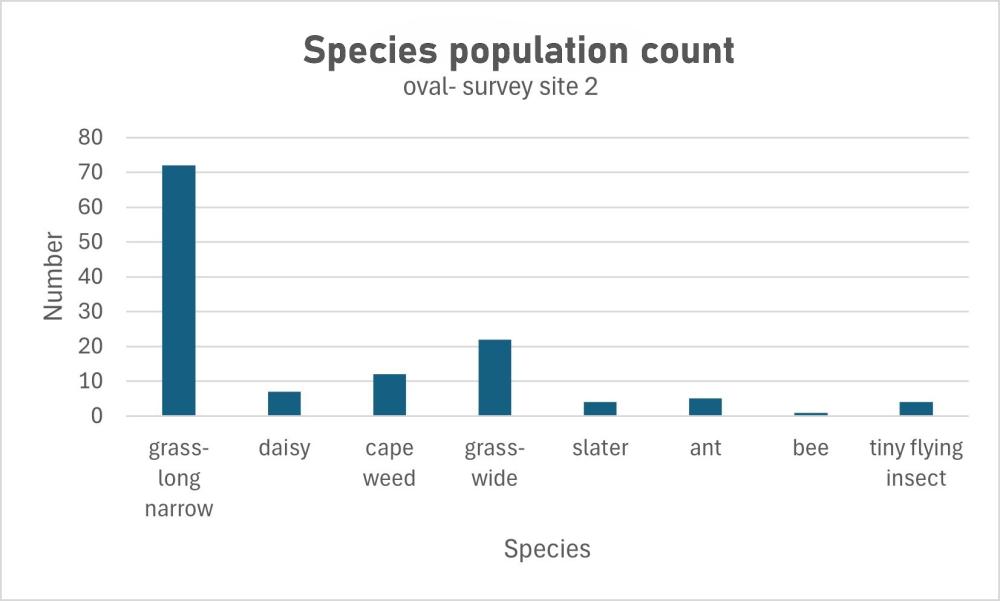
Teams describe the results of their habitat survey, including describing the area they surveyed and the plants and animals found there. Create a combined species list of all the plants and animals found in the school/area surveyed, including any relevant descriptions students created, and a running tally of how many of each species were counted.
Students independently use their group’s data to create a bar graph showing their species list and population count. They can do this on graph paper, using digital tools, or both. If required, model how to create a bar graph by making one as a class using the collated data from the species survey.
Describe and discuss other habitats in and near the school, and how the results of a habitat survey in those areas may or may not differ from the surveys students have undertaken.
Representing survey data
What are the benefits of representing survey data as a graph?
Representations come in many forms, from labelled photographs to observational or scientific drawings, from data tables to graphs. It is important that students identify when each representation should be used and the connections between them.
- Visual diagrams or photographs are powerful in clarifying shape and spatial relations or visualising sequences of events.
- Text is effective for expressing logical arguments, such as causal explanations.
- Tables help organise and focus attention on patterns in events or numbers.
- Graphs limit attention to any trends and relations.
Each representation has a series of “rules” that guide its construction. All four representations require headings, however, visual diagrams should be drawn in pencil and have labels that identify the key features, while line and column graphs need the axes clearly labeled (including the units used).
It is useful to challenge students to compare and critique different representations in books (e.g. the number of animals in a habitat). This will allow them to identify the key features and to develop their own graph or model representations for the change in populations.
Habitat types
What are the main types of habitats?
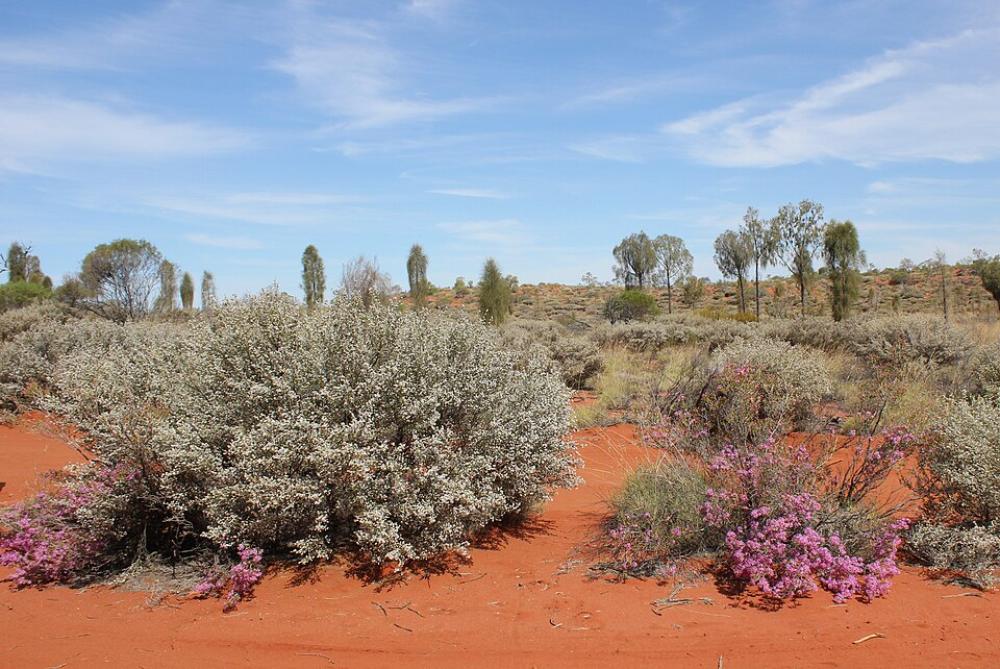
Habitats can be grouped into broad categories such as forests, grasslands, deserts, wetlands, and oceans, based on shared features like climate, plants, and animals. Within these broad categories, there are also more specific habitat types. For example, grasslands can be wild or not managed, where native plants grow freely and support a wide range of organisms or maintained grasslands, such as parks, paddocks, or lawns, which are regularly mown or grazed by people or livestock. These differences affect the types of organisms that can live there, showing how habitats can vary from very general to highly specific.
Forests are another broad habitat category, but they also include many more specific types. For example, dry sclerophyll forests are common in Australia and are dominated by a specific species of eucalyptus, wattles/acacias, and banksias, adapted to dry conditions and fire. In contrast, rainforests are dense forests in areas of high rainfall. They contain tall eucalyptus species with a layered sub-canopy structure that creates shady, moist conditions. These forest types support different organisms because of differences in moisture, temperature, soil, and light.
Habitats in school grounds vary significantly; some examples include:
- Grassland/meadow – maintained/mowed
- Grassland/meadow – wild/not maintained
- Wooded grassland – mixed trees, shrubs, and grass
- Dry sclerophyll forest – eucalypts, wattles/acacias and banksias
- Rainforest – layered structure, shade, high rainfall
- Wetland/marsh – at the bottom of a catchment
- Sand/beach
- Rockpool
The Inquire phase allows students to cycle progressively and with increasing complexity through the key science ideas related to the core concepts. Each Inquire cycle is divided into three teaching and learning routines that allow students to systematically build their knowledge and skills in science and incorporate this into their current understanding of the world.
When designing a teaching sequence, it is important to consider the knowledge and skills that students will need in the final Act phase. Consider what the students already know and identify the steps that need to be taken to reach the level required. How could you facilitate students’ understanding at each step? What investigations could be designed to build the skills at each step?
Read more about using the LIA FrameworkIdentifying and constructing questions is the creative driver of the inquiry process. It allows students to explore what they know and how they know it. During the Inquire phase of the LIA Framework, the Question routine allows for past activities to be reviewed and to set the scene for the investigation that students will undertake. The use of effective questioning techniques can influence students’ view and interpretation of upcoming content, open them to exploration and link to their current interests and science capital.
When designing a teaching sequence, it is important to spend some time considering the mindset of students at the start of each Inquire phase. What do you want students to be thinking about, what do they already know and what is the best way for them to approach the task? What might tap into their curiosity?
Read more about using the LIA FrameworkSpecies specifics
Refer back to any ants that students observed during their habitat survey (or see the embedded professional learning Adapting to your context on changing the focus of the investigation) and determine if they were all the same type of ant, or if more than one type of ant was observed. Size and colour are often the easiest way to distinguish between sub-species of ant.
Introduce the term “family” as the umbrella term scientists use to describe animals that are similar, but that can’t reproduce together (unlike those in a species, as defined earlier in the lesson, that can). Explain that (for example) ants are all from the family Formicidae because they are all similar, but they can only reproduce with ants of the same species.
Review the definition of “species” discussed earlier in the lesson.
Pose the questions: What are the similarities and differences between species of ant? Why might they have developed these differences?
The scientific classification of organisms
Scientists organise and communicate knowledge about the natural world.
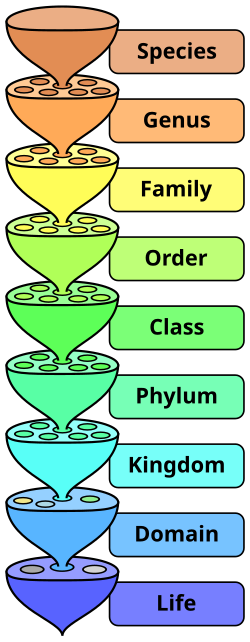
In the 1700s, Carl Linnaeus developed a systematic way of classifying all living things so scientists could organise and communicate knowledge about the natural world. This system, known as the Linnaean classification system, groups organisms based on shared physical characteristics and increasingly more detailed similarities.
The system is hierarchical, meaning organisms are placed into a series of ranked groups. These ranks move from broad to specific: kingdom, phylum, class, order, family, genus, and species. As students move down the hierarchy, organisms share more detailed features. For example, all animals belong to the same kingdom (Animalia), but only very closely related dog-like animals (wolves, jackals, coyotes, and domestic dogs) are included in the same genus Canis.
A key feature of this system is binomial nomenclature, where each organism is given a two-part scientific name (genus and species). This avoids confusion caused by common names, which can vary between regions and languages. A scientific name will be in italics or underlined, with the genus name starting with a capital, and the species name with a lower-case letter. For example, Homo sapiens means a modern human.
Scientists classify organisms by carefully observing and comparing characteristics such as body structure, reproduction, and other physical traits. Modern classification also incorporates genetic evidence, which helps confirm relationships and refine groupings.
It is important to emphasise that classification is not just about naming organisms, but about identifying patterns and relationships. Using a common system allows scientists to organise and effectively communicate about the diversity of life around the world.
Adapting to your context
How can you change this lesson to focus on a plant or animal species prevalent in your local area?
The focus of the investigation in the following step is to look closely at a common family of plants or animals that students will be familiar with, to compare the visible structures and basic behavioural similarities and differences between the species groups within that family. They will use these observations and other information to draw conclusions about how and why these similarities and differences may exist.
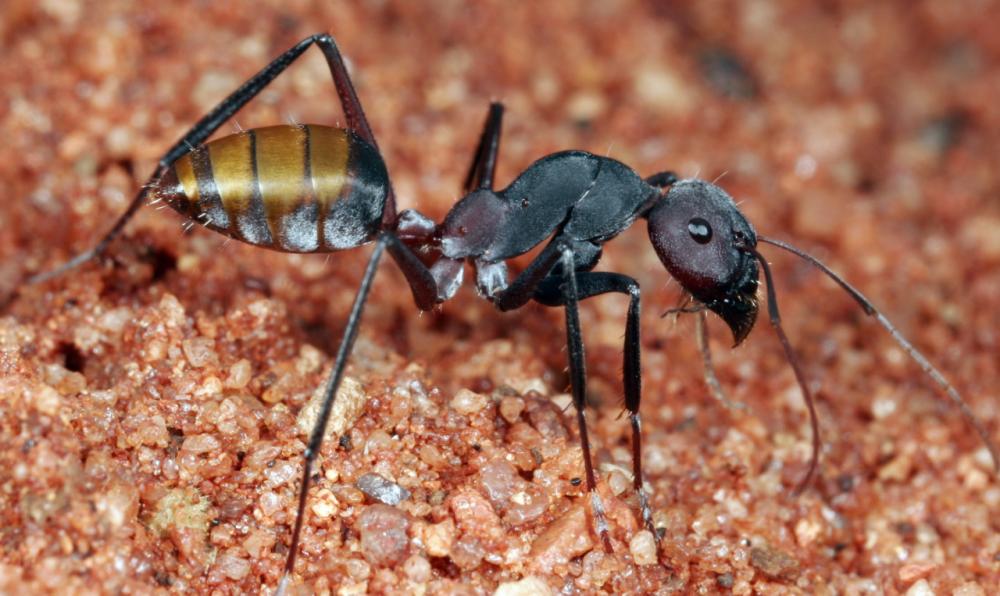
Ants have been chosen as the focus family for the investigation, as it is likely that students will have observed ants during their habitat surveys. Images of six species of ants that are commonly found in Australia have been included in the Ants Resource sheet.
If a local common ant species is not included on the resource sheet, add the information to the resource sheet. Include information about their body structure, behaviour, and diet. The Atlas of Living Australia includes detailed records of many ant species and, when combined with general internet searches, can be useful in identifying and describing ant species.
Alternatively, if another plant or animal species (e.g. Peron’s tree frog) is common in your area you might make a new resource sheet where students can instead focus on the similarities and differences between species in the frog family. In this case, the focus question will need to be changed to include the common family name of the plant/animal, for example ‘frogs’: What are the similarities and differences between species of ______? Why might they have developed these differences?
The focus of the investigation in the following step is to look closely at a common family of plants or animals that students will be familiar with, to compare the visible structures and basic behavioural similarities and differences between the species groups within that family. They will use these observations and other information to draw conclusions about how and why these similarities and differences may exist.
Ants have been chosen as the focus family for the investigation, as it is likely that students will have observed ants during their habitat surveys. Images of six species of ants that are commonly found in Australia have been included in the Ants Resource sheet.
If a local common ant species is not included on the resource sheet, add the information to the resource sheet. Include information about their body structure, behaviour, and diet. The Atlas of Living Australia includes detailed records of many ant species and, when combined with general internet searches, can be useful in identifying and describing ant species.
Alternatively, if another plant or animal species (e.g. Peron’s tree frog) is common in your area you might make a new resource sheet where students can instead focus on the similarities and differences between species in the frog family. In this case, the focus question will need to be changed to include the common family name of the plant/animal, for example ‘frogs’: What are the similarities and differences between species of ______? Why might they have developed these differences?
The Inquire phase allows students to cycle progressively and with increasing complexity through the key science ideas related to the core concepts. Each Inquire cycle is divided into three teaching and learning routines that allow students to systematically build their knowledge and skills in science and incorporate this into their current understanding of the world.
When designing a teaching sequence, it is important to consider the knowledge and skills that students will need in the final Act phase. Consider what the students already know and identify the steps that need to be taken to reach the level required. How could you facilitate students’ understanding at each step? What investigations could be designed to build the skills at each step?
Read more about using the LIA FrameworkThe Investigate routine provides students with an opportunity to explore the key ideas of science, to plan and conduct an investigation, and to gather and record data. The investigations are designed to systematically develop content knowledge and skills through increasingly complex processes of structured inquiry, guided inquiry and open inquiry approaches. Students are encouraged to process data to identify trends and patterns and link them to the real-world context of the teaching sequence.
When designing a teaching sequence, consider the diagnostic assessment (Launch phase) that identified the alternative conceptions that students held. Are there activities that challenge these ideas and provide openings for discussion? What content knowledge and skills do students need to be able to complete the final (Act phase) task? How could you systematically build these through the investigation routines? Are there opportunities to build students’ understanding and skills in the science inquiry processes through the successive investigations?
Read more about using the LIA FrameworkFollowing an investigation, the Integrate routine provides time and space for data to be evaluated and insights to be synthesized. It reveals new insights, consolidates and refines representations, generalises context and broadens students’ perspectives. It allows student thinking to become visible and opens formative feedback opportunities. It may also lead to further questions being asked, allowing the Inquire phase to start again.
When designing a teaching sequence, consider the diagnostic assessment that was undertaken during the Launch phase. Consider if alternative conceptions could be used as a jumping off point to discussions. How could students represent their learning in a way that would support formative feedback opportunities? Could small summative assessment occur at different stages in the teaching sequence?
Read more about using the LIA FrameworkGetting antsy
In this combined Investigate and Integrate routine, students are guided to link their observations about the structural features of an ant’s body with its habitat, food gathering, and other general behaviours. Through questioning and discussion, students should come to a consensus that:
|
Using the images on the Ants Resource sheet, examine the visible shared body features of different species of ants in the ant family, and read the information provided about their behaviour, diet etc.
Using the diagram of an ant provided on page 7 of the Ants Resource sheet, identify the similarities between the body structures of the different species of ants, and how they vary. Record these similarities and differences, and any others that students note, on a T-chart.
Optional: Examine the scientific classification of ants as provided and discuss scientific classification in general. See the information found on Britannica Kids.
Look at the extreme close-up images of the black trail ant and the red bull ant found on pages 8 and 9 of the Ants Resource sheet. Identify the specific differences between the two species of ants, with a focus on their eye size and position and the size and shape of the mandibles.
- The red bull ant’s eyes are much larger and in a more forward position on the ant’s head (close to the mandibles). A black trail ant’s eyes are smaller and set further back, further away from the mandibles.
- It may be difficult to see the specific size of each ant’s eye as they are both in close up, but remind students that a red bull ant worker is up to 3 cm long, whilst a black train ant worker is only 5 mm long.
- The mandibles of the red bull ant are long, thin, and deeply serrated. The mandibles of the black trail ant are much shorter, thicker, triangular, and not as serrated.
Review what each ant eats, and how it finds and captures its food.
Ask students to draw some conclusions about the size, shape, location of the eyes and mandibles, and how they might be related to the food it eats, how it captures its food, and any general behaviour it may exhibit.
- What are the visible differences between the red bull ant and the black trail ant that you can observe?
- What might be the advantages of the black trail ant being small and quick?
- Why do you think they work as a team to carry food back to the nest?
- Why do you think a red bull ant has such large eyes and exceptional vision?
- Why are their mandibles serrated?
- What body structures and behaviours can you relate to them being lone hunters?
- How do you think the ants’ different habitats influenced their body structure and behaviours?
- To support students in answering this question, it may be helpful to look at a variety of images of the red bull ant and black trail ant in their natural habitat, available through the Atlas of Living Australia.
- What do you think might happen if these ant species were placed in another, entirely different, habitat?
- What might the consequences, both positive and negative, be?
Introduce and define the term “adaptation”: a structure, function or behaviour of a plant or animal species that helps the organism to survive in a specific habitat. Note for students that a feature of a plant or animal's body that allows them to survive is called a “structural adaptation”, and a specific behaviour is called a “behavioural adaptation”.
Discuss which features of an ant students think are structural and behavioural adaptations.
Reflect on the lesson
You might:
- add vocabulary related to adaptations and surveys to the class word wall or glossary.
- add to the W and H sections of the TWLH chart.
- search for the local community groups or organisations that monitor and are interested in entomology or animal species, or plants, for example, Coastcare or Landcare groups, lepidopterists’ societies, or gardening and biodiversity groups. Determine ways in which interested students might get into contact, with appropriate supervision, with these groups.
- construct a class map of the habitats in the school grounds. Compare data across classes. If available, compare this year’s data to data collected in previous years and consider the reasons for any similarities and differences.