Adapt to survive
View Sequence overviewStudents will:
- use a model to investigate the evaporation rates of leaves with different surface areas.
- recognise that evaporation rates correlate with leaf surface area.
Students will represent their understanding as they:
- draw a line graph to compare the evaporation rates of folded and unfolded wet cloths.
- make a claim with supporting evidence about the effect of surface area on evaporation rate.
- participate in discussions, sharing information, experiences, and opinions.
In this lesson, assessment may be formative
Feedback might focus on:
- students’ claims with supporting evidence about leaf surface area. Have students used investigation data to support their claim?
- students’ line graphs. Have they accurately represented the evaporation data?
In this lesson, assessment can also be summative.
Students working at the achievement standard for Science inquiry should have:
- planned safe, repeatable investigations to identify patterns, test relationships, and make reasoned predictions.
- identified variables to be changed, measured, and controlled.
- used equipment to generate and record data with appropriate precision.
- constructed representations to organise and process data and information and describe patterns, trends, and relationships.
Refer to the Australian Curriculum content links on the Our design decisions tab for further information.
Whole class
Class science journal (digital or hard-copy)
Image of a prevalent local tree species or a tree on the school grounds, or demonstration copy of the What's in a tree? Resource sheet
Demonstration copy of the Transpiration investigation Resource sheet (or take your own photo showing similar)
At least 2 x large, clear plastic bags
A means of securing the plastic bags closed around a tree branch, for example masking tape, zip ties or similar
Demonstration copy of the Desert and forest leaves Resource sheet
Optional: Demonstration copy of the Surface area investigation planner Resource Sheet
Demonstration copy of the Variables grid Resource sheet
Optional: 2 x pieces of paper of different shapes but the same surface area, for example one long and thin (1 x 9 cm) and one short and wide (3 x 3 cm)
Optional: 1 cm x 1 cm cubes or 1 cm x 1 cm graph paper, to be used to measure the surface area of the two shapes above if using
Digital scales
Timing device such as a classroom clock
Drying rack/string over a drip-proof surface
Note: The investigation in this lesson is best carried out on a sunny day, as it will yield results more quickly. However, it will still work in other conditions, it just may take a longer time to observe results. Consider the season/weather when planning this lesson. In colder months, or overcast weather, you may need to begin the investigation early in the week, and return to finish the lesson on a later day.
Each group
2 absorbent cloths or pieces of paper towel
2 binder clips/bulldog clips
Water
Masking tape to name clips
Each student
Individual science journal (digital or hard-copy)
Surface area investigation planner Resource Sheet
Lesson
The Inquire phase allows students to cycle progressively and with increasing complexity through the key science ideas related to the core concepts. Each Inquire cycle is divided into three teaching and learning routines that allow students to systematically build their knowledge and skills in science and incorporate this into their current understanding of the world.
When designing a teaching sequence, it is important to consider the knowledge and skills that students will need in the final Act phase. Consider what the students already know and identify the steps that need to be taken to reach the level required. How could you facilitate students’ understanding at each step? What investigations could be designed to build the skills at each step?
Read more about using the LIA FrameworkRe-orient
Recall the previous lesson, focusing on the plants found during the habitat survey and their leaf size and shape.
Brainstorm what students think they know about leaves and record it in the class science journal.
Referring to the data/graph from the previous lesson, discuss which type of plant was the most common in the school environment and why students think that was the case.
The Inquire phase allows students to cycle progressively and with increasing complexity through the key science ideas related to the core concepts. Each Inquire cycle is divided into three teaching and learning routines that allow students to systematically build their knowledge and skills in science and incorporate this into their current understanding of the world.
When designing a teaching sequence, it is important to consider the knowledge and skills that students will need in the final Act phase. Consider what the students already know and identify the steps that need to be taken to reach the level required. How could you facilitate students’ understanding at each step? What investigations could be designed to build the skills at each step?
Read more about using the LIA FrameworkIdentifying and constructing questions is the creative driver of the inquiry process. It allows students to explore what they know and how they know it. During the Inquire phase of the LIA Framework, the Question routine allows for past activities to be reviewed and to set the scene for the investigation that students will undertake. The use of effective questioning techniques can influence students’ view and interpretation of upcoming content, open them to exploration and link to their current interests and science capital.
When designing a teaching sequence, it is important to spend some time considering the mindset of students at the start of each Inquire phase. What do you want students to be thinking about, what do they already know and what is the best way for them to approach the task? What might tap into their curiosity?
Read more about using the LIA FrameworkWhat’s in a tree?
Show students an image of a prevalent local tree species or a tree on the school grounds, or use the image on the What’s in a tree? Resource sheet.
Ask students to name the main parts of the tree, including those that can be seen and not seen (trunk, branches, leaves, roots), and what they know about each part.
Focus students’ attention on the tree’s roots and discuss their function: to draw in water and nutrients to the tree.
Pose the question: Where does the water a tree absorbs go? Does it all stay in the tree?
The Inquire phase allows students to cycle progressively and with increasing complexity through the key science ideas related to the core concepts. Each Inquire cycle is divided into three teaching and learning routines that allow students to systematically build their knowledge and skills in science and incorporate this into their current understanding of the world.
When designing a teaching sequence, it is important to consider the knowledge and skills that students will need in the final Act phase. Consider what the students already know and identify the steps that need to be taken to reach the level required. How could you facilitate students’ understanding at each step? What investigations could be designed to build the skills at each step?
Read more about using the LIA FrameworkThe Investigate routine provides students with an opportunity to explore the key ideas of science, to plan and conduct an investigation, and to gather and record data. The investigations are designed to systematically develop content knowledge and skills through increasingly complex processes of structured inquiry, guided inquiry and open inquiry approaches. Students are encouraged to process data to identify trends and patterns and link them to the real-world context of the teaching sequence.
When designing a teaching sequence, consider the diagnostic assessment (Launch phase) that identified the alternative conceptions that students held. Are there activities that challenge these ideas and provide openings for discussion? What content knowledge and skills do students need to be able to complete the final (Act phase) task? How could you systematically build these through the investigation routines? Are there opportunities to build students’ understanding and skills in the science inquiry processes through the successive investigations?
Read more about using the LIA FrameworkWhere does the water go?
The following investigation is best carried out on a sunny day, as it will yield results more quickly. However, it will still work in other conditions, though it may take a longer time to observe results. Consider the season/weather when planning this lesson. In colder months, or overcast weather, you may need to begin the investigation early in the week, and return to finish the lesson on a later day.
Explain to students how the investigation will be carried out: a plastic bag will be secured around the leaves of a healthy green tree for a few hours/days. Students will then make careful observations of what can be seen inside the bag to see if anything has changed. Use the image found on the Transpiration investigation Resource sheet (or prepare your own) to support students to visualise how the investigation is set up.
Ask students what claim about trees and water they think the investigation might be testing and why they think that. Students should have learned about evaporation and condensation in Year 4 Earth and space sciences, and may have already learned about the three states of matter as it appears in Year 5 Chemical sciences.
If required, present the claim to students that trees lose water through their leaves.
Discuss how the investigation might show the claim to be supported or incorrect.
Find a suitable tree/trees in the school ground and attach clear plastic bags as securely as possible, using either masking tape, zip ties (take care not to make them too tight and cut into the tree) or similar. Ensure that plenty of live leaves are inside the bag and that the bag is sealed around the stem/branch.
Place a “dead” stick (one no longer attached to a live tree and quite dried out), a pencil, or other piece of wood (that is approximately the same thickness as the stem/branch attached to the live leaves) into a plastic bag. Place the bag near the live leaves.
Ask students why the stick has been included in the investigation, and explain, if necessary, that this will allow students to compare the effects of live wood and leaves to those of dead wood. Any differences will be a result of this single variable.
Consider using labels or a sign to warn other members of the school community that a science investigation is in progress, to prevent anyone from “cleaning up” the bags.
Leave the plastic attached to the tree for long enough that condensation begins to form inside the plastic bag. The time frame required will depend on the weather. Periodically send students to make observations of the live and dead wood.
Transpiration
How do trees lose water?
Animals circulate water and nutrients through their bodies using circulatory systems and organs, such as hearts and blood vessels.
Plants also circulate water and nutrients. Plants have stomata (small openings) in their leaves through which water can evaporate. This process is called transpiration.
The plants’ stomata open to allow water and gases to move in and out, and close to help prevent water loss. In very hot environments, closed stomata help to prevent the rapid loss of water that might lead to the leaves wilting. Some desert plants have stomata that only open at night. Having smaller and fewer leaves decreases the number of stomata and, therefore, decreases the amount of water lost. Other leaf adaptations include:
- waxy cuticles (leaf covering on the upper surface) to help stop water from escaping.
- light-coloured pigments that help to reflect the Sun's heat.
- allowing leaves to droop during the hotter days to reduce the exposure to the sun.
- shedding leaves during dry seasons.
- storing water inside the leaves.
- leaves rolling up with stomata on the inside surface.
The Inquire phase allows students to cycle progressively and with increasing complexity through the key science ideas related to the core concepts. Each Inquire cycle is divided into three teaching and learning routines that allow students to systematically build their knowledge and skills in science and incorporate this into their current understanding of the world.
When designing a teaching sequence, it is important to consider the knowledge and skills that students will need in the final Act phase. Consider what the students already know and identify the steps that need to be taken to reach the level required. How could you facilitate students’ understanding at each step? What investigations could be designed to build the skills at each step?
Read more about using the LIA FrameworkFollowing an investigation, the Integrate routine provides time and space for data to be evaluated and insights to be synthesized. It reveals new insights, consolidates and refines representations, generalises context and broadens students’ perspectives. It allows student thinking to become visible and opens formative feedback opportunities. It may also lead to further questions being asked, allowing the Inquire phase to start again.
When designing a teaching sequence, consider the diagnostic assessment that was undertaken during the Launch phase. Consider if alternative conceptions could be used as a jumping off point to discussions. How could students represent their learning in a way that would support formative feedback opportunities? Could small summative assessment occur at different stages in the teaching sequence?
Read more about using the LIA FrameworkTranspiration
In the following Integrate routine, students are guided to link their experiences and observations in the investigation to the science concept being explored—that is, living plants lose water through their leaves, and that this process is called transpiration. Through questioning and discussion, students should come to a consensus that:
|
Once enough time has passed that condensation can be observed inside the bags wrapped around the leaves, the investigation can be concluded.
Take students to observe the bag/leaves and discuss their observations in situ.
- What can you see inside the plastic bags wrapped around the live leaves?
- Students might describe the condensate that has formed as steam, sweat, fog etc. That is fine at this stage.
- If students use the term “sweat” it might be necessary to think about the different meanings of that word to avoid reinforcing misconceptions. See the embedded professional learning Condensation and “sweat” for more information.
- What do you think it is made of?
- Where do you think it comes from?
- Is the same thing present in the plastic bag wrapped around the stick we used as a control?
- If the dead wood was completely dried out, and the plastic bag was completely dry, there should be no condensation present. If there is water present, it is important to discuss with students where it came from. For example, it may have been formed by a water droplet getting into the bag or by moisture still inside the wood. You might test the wood by attempting to break it. If moisture is still present the inside might still appear green, rather than completely brown.
- Why do you think that is?
After returning to the classroom, if required, introduce the term “condensation”: the process where water droplets are formed when water in its gaseous state (water vapour, steam, fog) contacts a cooler surface or cooler air and reverts to its liquid state.
Present (or re-present) the claim that trees lose water through their leaves and ask students if and how they think the investigation supports that claim. Students should conclude that the presence of condensate in the plastic bag around the leaves shows that water vapour must be escaping from the leaves of the live plant. The absence of any water vapour in the bag around the dead wood confirms that living trees, and indeed all other living plants, lose water.
Introduce the term “transpiration”: the process of trees and other plants losing water through their leaves.
Condensation and “sweat”
When is sweating a form of condensation, and when isn't it?

Condensation is the process of water vapour (water gas) cooling to form water droplets (the condensate). Water vapour, steam, and fog are all a result of condensation. Sweat is a little trickier as the term can be used to describe two opposite processes.
If students used the term “sweat” to describe what was observed inside the bag wrapped around the live tree leaves, it’s important to delineate between “sweat” in this instance and human sweat.
When a cooler item (e.g. a cold can of soft drink) comes into contact with warmer air, the water vapour in the air reverts to its liquid state and becomes water droplets on the outside of the can. Some people might use a phrase like the can (or other cold item) is “sweating”.
Similarly, when a hot item (e.g. a BBQ chicken in a bag) comes into contact with the colder air around it, the steam inside the bag reverts to its liquid state as it contacts the cooler air surrounding the bag. This forms water droplets on the inside of the bag. While some people might use the phrase the chicken (or other hot food) is “sweating”, this process is not an active process (it does not need energy from a living organism). It is more accurate to say the water vapour from the chicken is condensing.
When a human sweats, it means that their body actively secretes liquid (99% of it water, and the rest made of salt, urea, and other compounds) through the skin’s pores. When the sweat evaporates, the body cools down. In areas that have high humidity, the high levels of water vapour in the air make it more difficult for the sweat to evaporate. This means the liquid sweat remains on the skin, and the body does not cool.
In this instance, because the air inside the bag around the leaves is not circulating, it will have higher humidity than the air outside the bag. The water transpiring from the tree’s leaves is water vapour that comes into contact with the cooler air outside the bag. So, similar to a BBQ chook, it can be said to be condensing.
The Inquire phase allows students to cycle progressively and with increasing complexity through the key science ideas related to the core concepts. Each Inquire cycle is divided into three teaching and learning routines that allow students to systematically build their knowledge and skills in science and incorporate this into their current understanding of the world.
When designing a teaching sequence, it is important to consider the knowledge and skills that students will need in the final Act phase. Consider what the students already know and identify the steps that need to be taken to reach the level required. How could you facilitate students’ understanding at each step? What investigations could be designed to build the skills at each step?
Read more about using the LIA FrameworkIdentifying and constructing questions is the creative driver of the inquiry process. It allows students to explore what they know and how they know it. During the Inquire phase of the LIA Framework, the Question routine allows for past activities to be reviewed and to set the scene for the investigation that students will undertake. The use of effective questioning techniques can influence students’ view and interpretation of upcoming content, open them to exploration and link to their current interests and science capital.
When designing a teaching sequence, it is important to spend some time considering the mindset of students at the start of each Inquire phase. What do you want students to be thinking about, what do they already know and what is the best way for them to approach the task? What might tap into their curiosity?
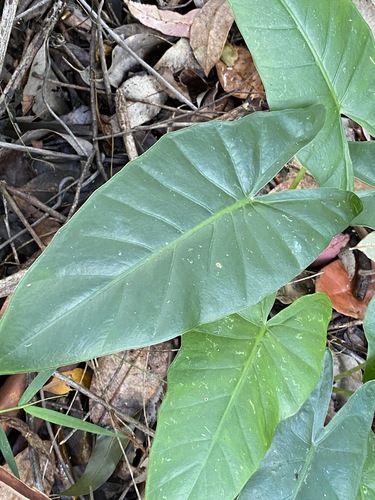
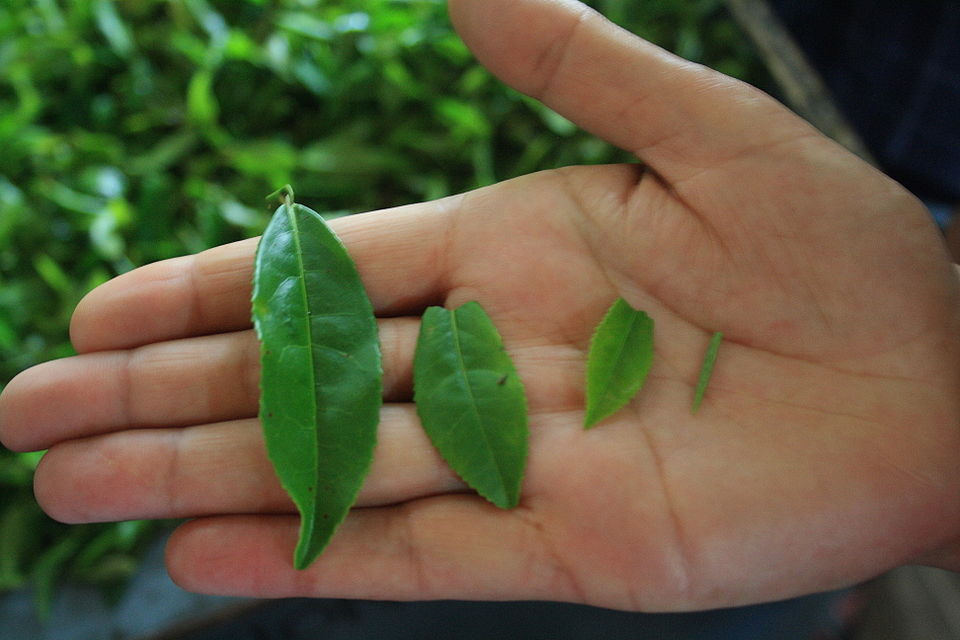
Read more about using the LIA FrameworkDesert leaves vs forest leaves
Display a demonstration copy of the Desert and forest leaves Resource sheet.
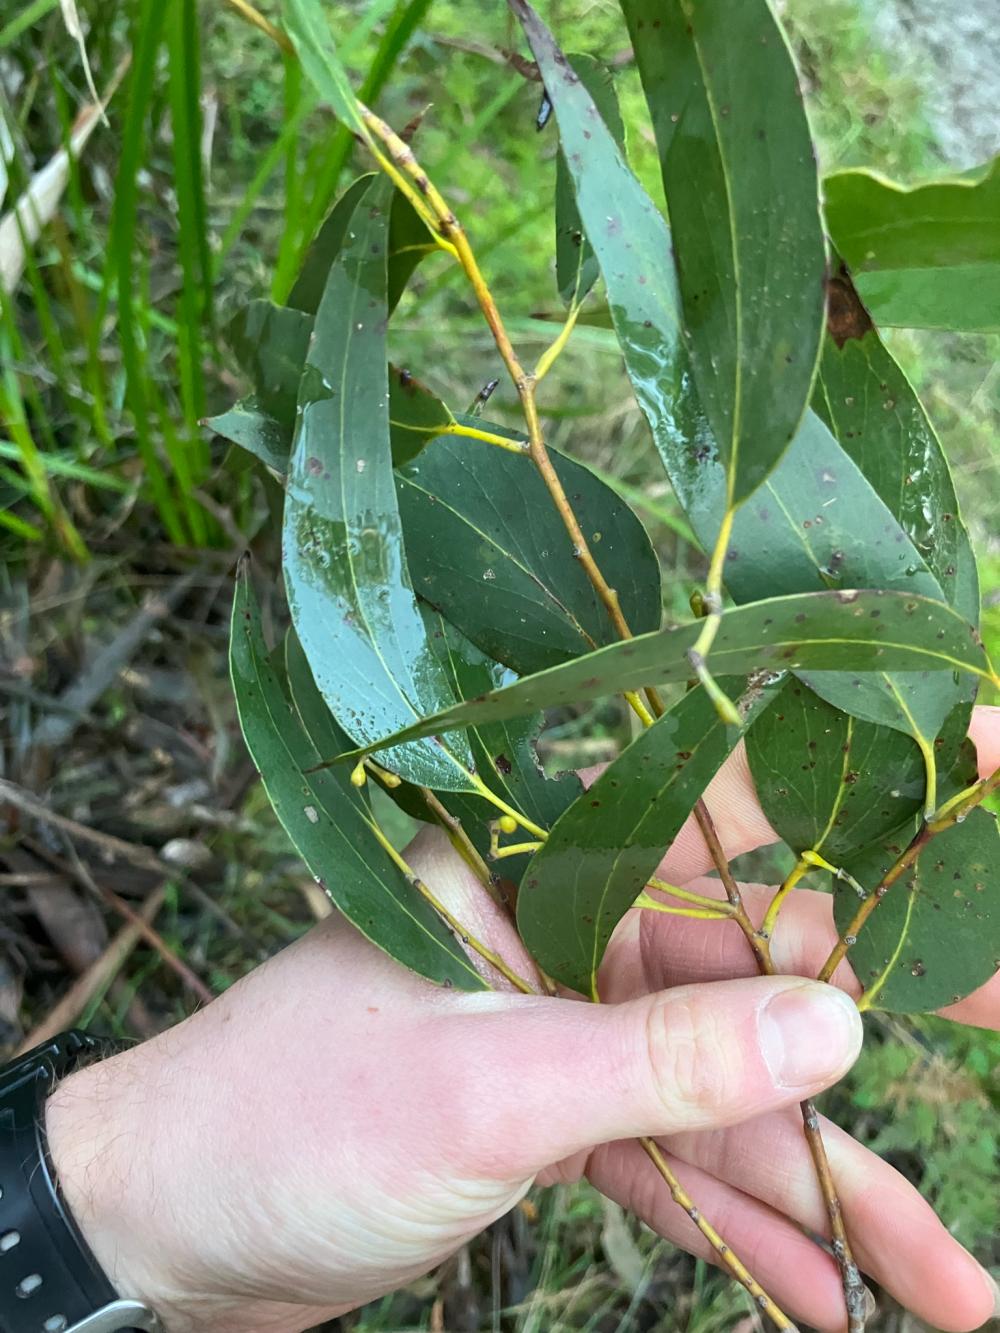
Discuss the visible similarities and differences between the leaves of the two plants on display, the mulga (Acacia aneura) and the mountain ash (or giant ash, Eucalyptus regnans), and the habitat of each tree species.
- How are the leaves similar?
- Both are growing from a branch, both are green in colour.
- How are the leaves different?
- Mulga leaves are narrow, straight, silvery-grey and mostly pointed upwards.
- Mountain ash leaves are darker green, with no silvery tinge. They are wider, larger and are mostly pointing towards the ground.
- What type of habitat do you think both tree species typically grows in? Use the visual clues in the images to support your thinking.
- What is different about these two habitats?
- The mulga grows in flat grasslands, where there is much less rainfall—typically between 50 ml to 250 ml per year (although it can survive in places with up to 500 ml rainfall per year). It is found in Western Australia, the Northern Territory, South Australia, Queensland and New South Wales, mostly in the drier parts of those states.
- The mountain ash grows in cool mountainous areas that receive a lot of rainfall—at least 1000 ml a year. It is common in Victoria and Tasmania.
- Now that we know that trees lose water through their leaves, why do you think we might be investigating more about the size of leaves and the relationship between leaf size and habitat?
- What structural adaptations might the trees have to be best suited to these different habitats?
- Which of the tree species has smaller leaves? Why do you say that?
- Do you think that the size of a leaf affects how a tree survives?
Explain that describing the leaves as “bigger” or “smaller” can sometimes be ambiguous, vague and inaccurate, and that there is a better way to determine the size of something.
Introduce the term “surface area”: a measure of how much of an object is in contact with the outside world (often the air). Record an agreed definition of surface area in the class science journal.
Optional: You might demonstrate surface area by showing students two pieces of paper (with the same surface area, but don’t explain this yet), one long and thin (1 x 9 cm) and one short and wide (3 x 3 cm). Discuss what students think of the size of the pieces of paper, if one is larger than the other, and why/why not. Demonstrate that the surface area is the same by covering the paper in 1 cm x 1 cm cubes or 1 cm x 1 cm graph paper. Conclude that two items might appear to be different sizes because of their shape, but their surface area may be the same.
Pose the question: Now that we know that trees lose water through their leaves, does the size of the leaves affect how much water they lose? Or in simpler terms, Do big leaves lose more water than small leaves?
Surface area
Why is it important to distinguish between the terms “smaller” and “less surface area” in this instance?
The term “smaller” is ambiguous in science, whereas “surface area” is a precise measurement of how much total area the surface of a three-dimensional object occupies.
In this investigation students fold a cloth to reduce its contact with the air (similar to the way rice, maize and wheat plants roll leaves in drought conditions). The total volume of the object remains the same but its surface area changes. Students might say that the folded cloth stays wet because it is “thicker”. While this is not incorrect it is important for students to realise that there is the same amount (mass) of cloth. It is the overall surface area that is exposed to the atmosphere that affects the amount of water lost.
By measuring the surface area of the cloths (the section exposed directly to the atmospheric conditions of the day), students can feel confident that the conclusions they draw are based on accurate and comparable data.
Using damp cloths as a model
Measuring water loss of leaves requires precise instruments, as the water mass lost might be a small percentage of the actual mass of the leaves. Absorbent cloths are used in this investigation since they can absorb enough water for water-loss differences to be measurable in the classroom with simple digital scales. Folding one multiple times (similar to the rolled up leaves) exaggerates surface-area difference, making measurement easier. However, there are many differences between a cloth and a leaf. For example, cloths lose water uniformly over the surface in contact with the air, whereas leaves might have waxy surfaces and lose most water through stomata during the day.
The Inquire phase allows students to cycle progressively and with increasing complexity through the key science ideas related to the core concepts. Each Inquire cycle is divided into three teaching and learning routines that allow students to systematically build their knowledge and skills in science and incorporate this into their current understanding of the world.
When designing a teaching sequence, it is important to consider the knowledge and skills that students will need in the final Act phase. Consider what the students already know and identify the steps that need to be taken to reach the level required. How could you facilitate students’ understanding at each step? What investigations could be designed to build the skills at each step?
Read more about using the LIA FrameworkThe Investigate routine provides students with an opportunity to explore the key ideas of science, to plan and conduct an investigation, and to gather and record data. The investigations are designed to systematically develop content knowledge and skills through increasingly complex processes of structured inquiry, guided inquiry and open inquiry approaches. Students are encouraged to process data to identify trends and patterns and link them to the real-world context of the teaching sequence.
When designing a teaching sequence, consider the diagnostic assessment (Launch phase) that identified the alternative conceptions that students held. Are there activities that challenge these ideas and provide openings for discussion? What content knowledge and skills do students need to be able to complete the final (Act phase) task? How could you systematically build these through the investigation routines? Are there opportunities to build students’ understanding and skills in the science inquiry processes through the successive investigations?
Read more about using the LIA FrameworkModelling transpiration
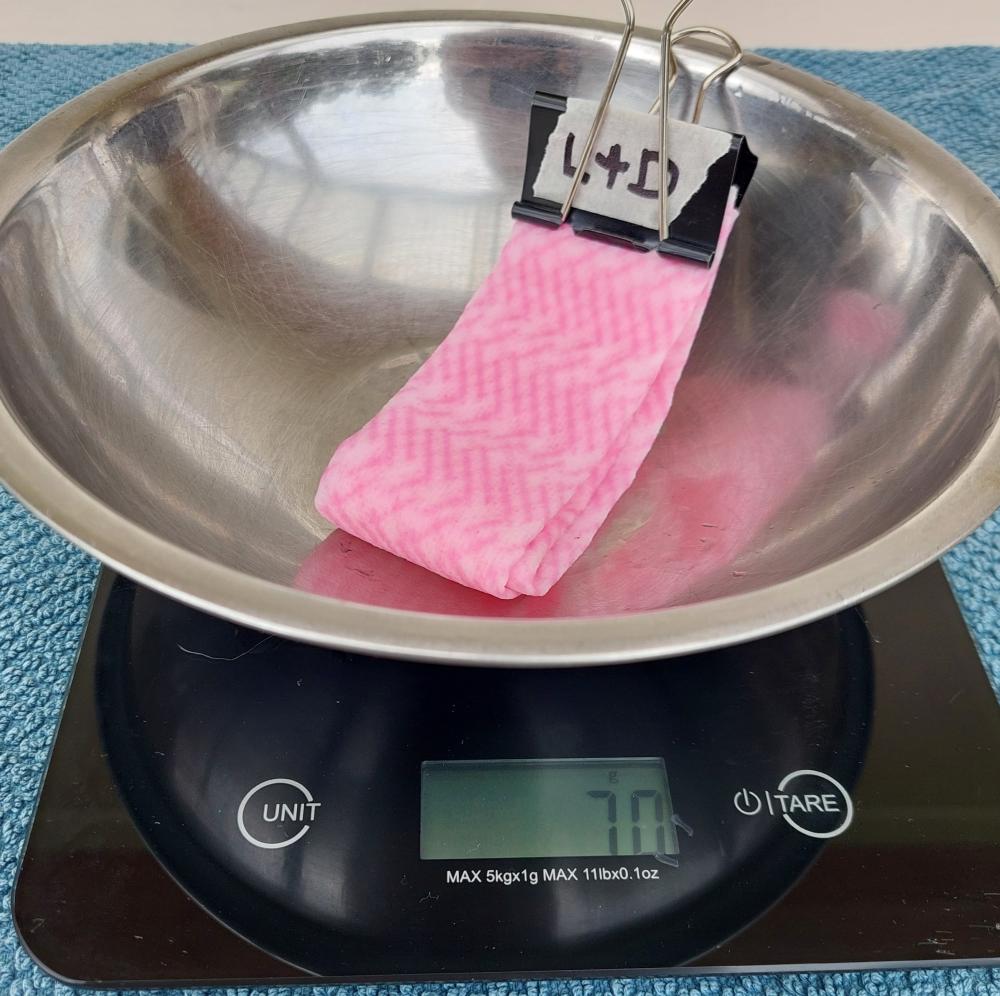
Explain to students that they will use folded or unfolded cloths as models for different sized leaves as a means of investigating if a leaf’s surface area has an impact on how much water it is able to retain/lose. They will wet the cloths and then collect data on how much water is lost over time, by weighing the cloths on digital scales a minimum of twice at appropriate intervals.
NOTE: The length of the intervals will be dictated by the climate and the weather conditions on the day of the investigation. In warmer weather the cloths can be expected to dry more quickly, so data should be collected every 15-30 minutes. In mild to cool conditions data can be collected at hourly intervals. It may be helpful to consult the weather forecast and conduct your own informal test investigation the day before to determine the right interval. Discuss/explain this to students if appropriate.
Explain that when scientists want to test, explore, or investigate phenomenon that require intricate equipment, sometimes they will build and use a model. For biologists (scientists that study living things), models provide insights without having to use (and potentially harm) real specimens.
In this case using absorbent cloths as a stand in for leaves is an efficient classroom model because the cloths hold water that is then evaporated at different rates depending on the conditions. Transpiration is one type of evaporation (the evaporation of water from leaves into the atmosphere).
Discuss with students the advantages and disadvantages of using models, and how the cloths replicate the two different leaf shapes looked at, the mulga (the wrapped cloth) and the mountain ash (the open cloth).
Pose the general question: What things might affect how much water a cloth loses over time?
Using a demonstration model of Variables grid Resource sheet, record what students will be measuring in the centre of the grid (water loss) and mark it with an “M”. Brainstorm and record possible variables for the investigation around this. These might include the type of cloth, the size of cloth, the temperature of the classroom, the location of the cloth (in the breeze or not), the exposed surface area of the cloth etc. Add or remove columns and rows as required.
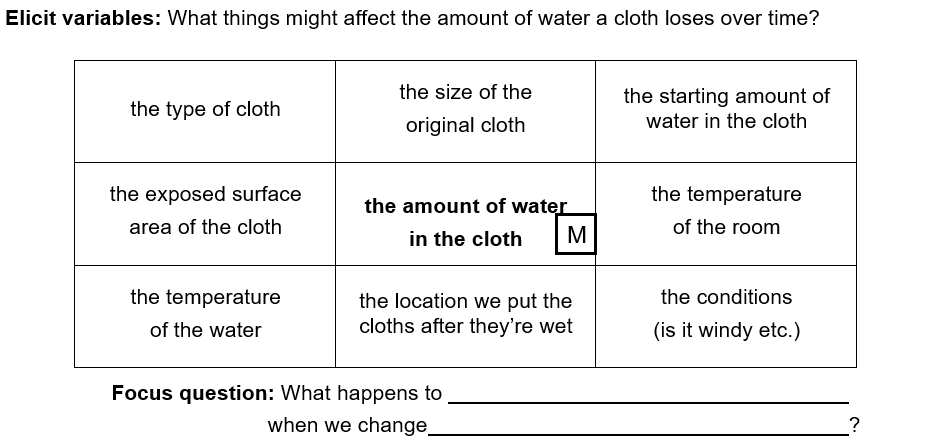
Mark what is going to be changed (the surface area of the cloth) with a “C”, and what is going to remain the same (all the other variables) with an “S”.
Model how to use the question stem to write a question for the investigation: What happens to the amount of water in the cloth when we change the exposed surface area of the cloth?
Use a demonstration copy of the Surface area investigation planner Resource sheet to discuss in more detail how to plan the investigation, conduct the investigation, and record data, if required.
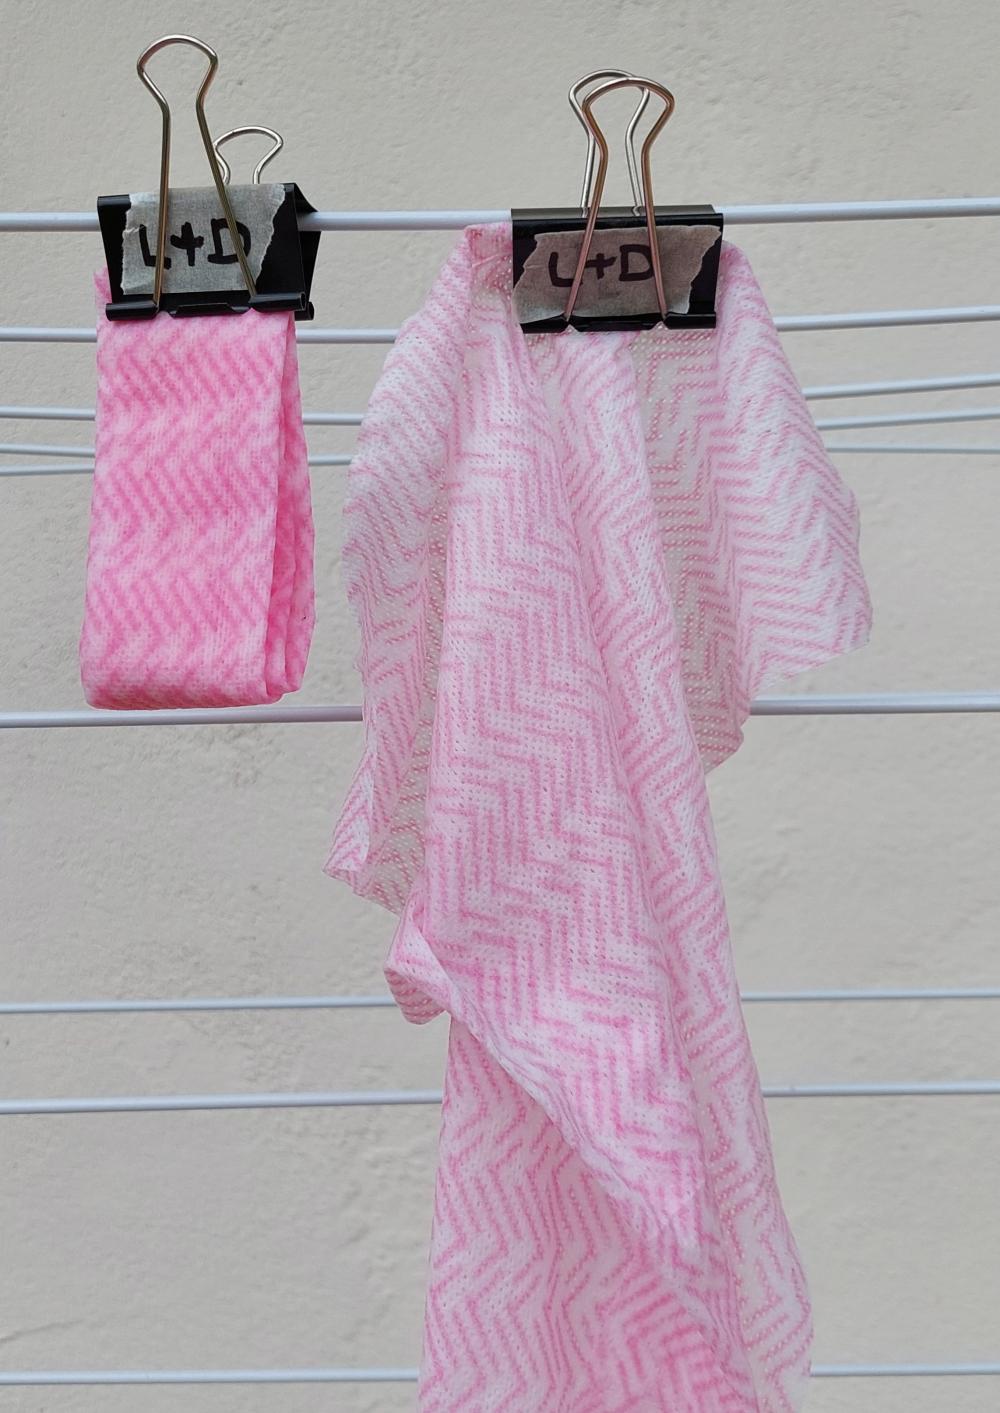
Discuss how to change the exposed surface area of the cloth while controlling the other variables, for example:
- fold the second cloth in half four times and fix it together with a binder clip. The first cloth will stay flat with a binder clip attached to the side for consistency.
- the amount of water in each cloth needs to be the same at the beginning. This can be achieved by squeezing water out until they weigh the same or by measuring how much water to put on them.
 |  |
In collaborative teams, students plan and conduct their investigation, recording their results using pages 1 and 2 of the Surface area investigation planner Resource sheet. Ensure all students first complete the “predict” section of the planner before beginning the investigation process.
Making links to Mathematics
How can authentic links be made to the Mathematics curriculum?
This lesson provides an opportunity to address mathematics content in a real-world scientific investigation.
Two content descriptions in measurement are particularly relevant:
- Choose appropriate metric units when measuring the length, mass and capacity of objects; use smaller units or a combination of units to obtain a more accurate measure (AC9M5M01).
- Solve practical problems involving the perimeter and area of regular and irregular shapes using appropriate metric units (AC9M5M02).
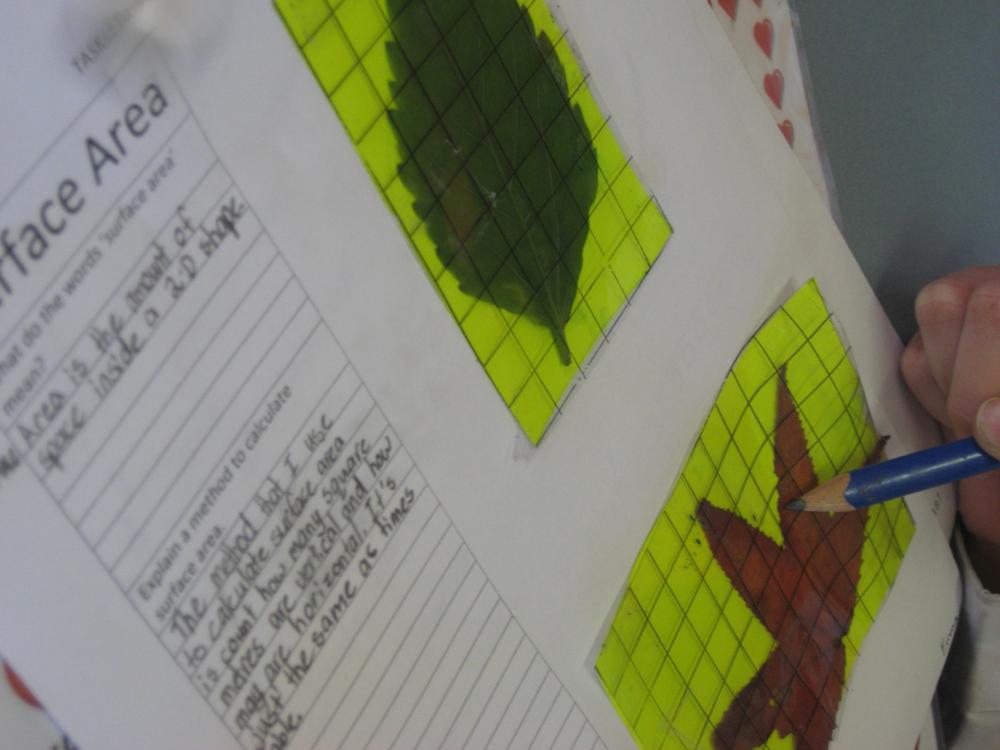
An additional lesson could be spent calculating the surface area of a variety of leaves using 1 cm grid paper. This can be completed by drawing around different-sized leaves on graph paper. The number of squares that are contained on the inside of the leaf can then be counted or calculated.
Students might then use these values to predict the number of stomata on the surface of the leaf (assuming the greater the surface area, the greater the number of stomata). This can then be supported with evidence from the findings of the wet cloth investigation.
This lesson provides an opportunity to address mathematics content in a real-world scientific investigation.
Two content descriptions in measurement are particularly relevant:
- Choose appropriate metric units when measuring the length, mass and capacity of objects; use smaller units or a combination of units to obtain a more accurate measure (AC9M5M01).
- Solve practical problems involving the perimeter and area of regular and irregular shapes using appropriate metric units (AC9M5M02).
An additional lesson could be spent calculating the surface area of a variety of leaves using 1 cm grid paper. This can be completed by drawing around different-sized leaves on graph paper. The number of squares that are contained on the inside of the leaf can then be counted or calculated.
Students might then use these values to predict the number of stomata on the surface of the leaf (assuming the greater the surface area, the greater the number of stomata). This can then be supported with evidence from the findings of the wet cloth investigation.
Using scientific models
Why are models used in science?
There are many different reasons that models are used in science. Models may be physical (globe or skeleton), mathematical (equations that represent relationships), computerised (global warming), or conceptual (diagram of the water cycle).
Models can be used to:
- understand complex systems by breaking large systems into manageable parts. For example, climate models can be used to simulate Earth’s atmosphere and oceans to understand weather patterns and climate change.
- make predictions about how different conditions would affect the outcome. For example, models of disease spread help to predict how a new illness could move through a population.
- safely test hypotheses that might be too dangerous, expensive, or unethical to test in real life. For example, car test simulations.
- communicate ideas through visualising and explaining difficult concepts. For example, the Bohr model of the atoms used by students.
- explore things that can’t be directly observed due to being too large or too small. For example, to model the solar system or the structure of DNA.
All models have limitations, and it is useful to discuss these with students whenever the models are used.
In this lesson, students are using a wet cloth to test predictions of the factors that affect how quickly a plant loses water. Scientists can complete similar experiments using more accurate (and expensive) potometers.
The Inquire phase allows students to cycle progressively and with increasing complexity through the key science ideas related to the core concepts. Each Inquire cycle is divided into three teaching and learning routines that allow students to systematically build their knowledge and skills in science and incorporate this into their current understanding of the world.
When designing a teaching sequence, it is important to consider the knowledge and skills that students will need in the final Act phase. Consider what the students already know and identify the steps that need to be taken to reach the level required. How could you facilitate students’ understanding at each step? What investigations could be designed to build the skills at each step?
Read more about using the LIA FrameworkFollowing an investigation, the Integrate routine provides time and space for data to be evaluated and insights to be synthesized. It reveals new insights, consolidates and refines representations, generalises context and broadens students’ perspectives. It allows student thinking to become visible and opens formative feedback opportunities. It may also lead to further questions being asked, allowing the Inquire phase to start again.
When designing a teaching sequence, consider the diagnostic assessment that was undertaken during the Launch phase. Consider if alternative conceptions could be used as a jumping off point to discussions. How could students represent their learning in a way that would support formative feedback opportunities? Could small summative assessment occur at different stages in the teaching sequence?
Read more about using the LIA FrameworkChanges over time
In the following Integrate routine, students are guided to link their experiences in the investigation to how surface area can affect how much water a tree loses—leaves with large surface areas lose more water than smaller ones—and that trees in drier habitats often have the structural adaptation of smaller/narrower leaves to help retain water because they have less access to it. Through questioning and discussion, students should come to a consensus that:
|
Students share the results of their investigations, specifically how the mass of each cloth changed over time.
Discuss the change and compare it to students’ initial predictions. Encourage students to probe deeply into groups’ results (and later in the discussion, their claims) using the science question starters.
Optional: If each group used the same brand/type of cloth in the same size and folded in the same manner (so their results are comparable), record the groups’ results of how the mass of the cloth changed over time in the class science journal and determine the average change. Alternatively, you might talk about the differences in groups’ results and how these factors contributed to these differences.
Discuss with and model for students how to construct a line graph to visually represent the data they recorded, including:
- the conventions of constructing a scientific graph: the vertical (or $y$) axis usually represents the variable we measure, and the horizontal (or $x$) axis represents the variable that we change.
- how to draw the two axes and what scale to use on the $y$ axis, for example, one box represents 10 g.
- how to draw two lines on their line graph in different colours, one for each cloth “shape”.
- how to record which cloth corresponds to which colour on the graphs using a key.
- how drawing two lines allows you to compare what is happening in each cloth.
If students are already experienced in constructing line graphs, they can do this independently. You might also provide them with exemplar line graphs and allow them to identify the key features before constructing one on their own.
Students analyse their graphs to look for patterns and relationships, and to make a scientific claim, supported by evidence, about leaf shape and its relationship to the habitat a tree might live in.
- What “story” does your graph tell?
- Did the different cloths lose a different amount of water over time? What data supports your answer?
- Which cloth type lost more water?
- Was that what you predicted? Why do you think the result was different from your prediction?
- What claim can you make about which type of cloth loses more water? For example, “Cloth A lost more water because it weighed less after # time.”
- How do you think this might relate to the shape of leaves in different habitats?
- What type of leaves did the tree living in the wetter habitat have?
- What type of leaves did the tree living in the drier habitat have?
- Why would their leaves be shaped differently, and how is this difference influenced by their natural habitats?
- Do you still agree with the reasons you provided for your predictions?
- How does the data of the investigation confirm or change your thinking?
- From these results, what claim could be made about the structural adaptations of plants that might help prevent water loss?
- Leaves with a smaller surface area help plants survive because they lose less water through transpiration.
- What evidence do you have to support your claim?
- The model of the folded cloth with a smaller surface area weighed more after # hours because it retained more water.
Explain that the claims about plants need to be conditional (using the word “could”) since the results are based on a model and not actually biological samples of plants in dry habitats. For example, “Having leaves with smaller surface area could help plants survive because there is less leaf surface for transpiration to take place.”
Further explain the reasons plants in drier habitats have smaller leaves, such as:
- Plants have openings in their leaves, called stomata, through which transpiration occurs.
- Having smaller and fewer leaves decreases the number of stomata and therefore the amount of water loss/transpiration.
- Some plants also have fewer and smaller stomata.
- The plants’ stomata close to reduce water loss.
Optional: Take an observation walk through the school grounds to consider and compare leaf surface area and the likelihood that the plant is adapted to dry conditions. Alternatively, leaves collected for a nature table or leaf gallery (from Lesson 1) could also be used.
Optional: Invite a botanist to attend the classroom (virtually or physically) to provide some local examples. Ask a horticulturalist or farmer to explain what they do to support their plants in hot weather.
Optional: Investigate other plant adaptations for dry conditions, for example:
- View the video David Attenborough—The fascinating life cycle of desert plants (5:41).
- Carry out a waxy leaves investigation: Discuss how wet cloths could also be used to investigate the claim that waxy coatings on leaves help to reduce water loss. For example, by comparing two wet folded cloths, with one wrapped in baking paper.
Reflect on the lesson
You might:
- add vocabulary related to surviving in dry environments to the class word wall or glossary.
- add to the W and H sections of the TWLH chart.
- revisit initial brainstorm and add to it—this represents what you learned.
- discuss how the learning from this lesson will be relevant for building a model of a plant or animal’s adaptations, including:
- using alternate materials when modelling.
- leaf adaptations that enable survival in habitats with limited water.
- where else might models be useful in considering how things work?