Chemistry in the kitchen
View Sequence overviewStudents will:
- observe candles and their separate parts.
- investigate how candles need oxygen to keep burning.
Students will represent their understanding as they:
- discuss whether each candle component burns separately.
- predict, with reasoning, which bottle size will allow the candle to burn longer.
- collect data and record observations.
- conduct replication trials and calculate the average (optional).
- create a line graph to show how bottle size effects how long a candle stays lit (due to the amount of oxygen available).
In this lesson, assessment is formative.
Feedback might focus on:
- students’ use of experience for their predictions. Did they predict that the candle would burn longer inside the larger bottle?
- students’ explanation of results. Did students recognise that the bottle size affected the amount of oxygen available to keep the candle lit?
- students’ predictions for an additional bottle size. Do students use the line graph effectively to predict how long a candle will stay lit under a certain-sized bottle?
Whole class
Class science journal (digital or hard-copy)
Demonstration copy of Melt or burn Resource sheet
Demonstration copy of A3 line graph template Resource sheet
8 or 9 x identical candles (tealight candles recommended) which will be used during the lesson in the following sets:
- 3 x candles
- 1 intact
- 1 burnt until only a stub is left
- 1 melted, by putting it in an oven in a foil tray for example
- 2 x candles
- 1 intact (can be same as above)
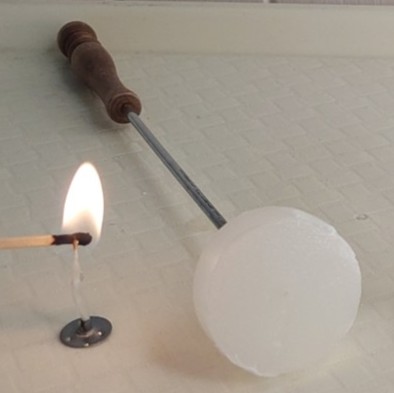
- 1 separated into its components—wick separated and wax on a metal skewer or fondue fork, as shown below
- 3 or 4 x candles, all intact, to be used for the main investigation
1 x birthday candle, or other thin candle that will burn quickly, and its decreasing length will be obvious
Optional: Blu-tack, to keep candles stable on tabletop if required
Matches
Demonstration copy of the Variables grid Resource sheet
Timing device(s) such as stopwatches/tablets. Multiple timing devices can assist to engage students and compare data.
3 or 4 x clear glass jars of varying size, such as 120 ml baby food jar, 250 ml tartare sauce jar, 330 ml salsa jar, 500 ml pasta sauce jar
Measuring tool to find the capacity of each jar, such as digital scales or measuring jug and water
Paper towel
Demonstration copy of the Fire triangle Resource sheet
Resources on the impact that cooking food, enabled by humans’ use and control over fire, has had on human survival. Some resources to support this are listed below. Select resources that are appropriate for your students and context or add your own.
- Video: The origins of cooking: how food shaped human history (13:35)
- Note: Please be advised that this video intended for instructional use contains a brief image of a female breast (blurred at approximately 1:30 and in side profile at approximately 6:35 minutes), and we recommend previewing the material in advance to determine its appropriateness for your students and to follow any necessary school policies regarding parental notification or alternative assignments.
- Article: Fire and the brain: how cooking shaped humans by American Museum of Natural History
- Article: Cooking by Britannica Kids
- Article: Every human culture includes cooking – this is how it began in New Scientist
Each student
Individual science journal
Optional: PROE Resource sheet
Optional: A4 line graph template Resource sheet
Lesson
The Inquire phase allows students to cycle progressively and with increasing complexity through the key science ideas related to the core concepts. Each Inquire cycle is divided into three teaching and learning routines that allow students to systematically build their knowledge and skills in science and incorporate this into their current understanding of the world.
When designing a teaching sequence, it is important to consider the knowledge and skills that students will need in the final Act phase. Consider what the students already know and identify the steps that need to be taken to reach the level required. How could you facilitate students’ understanding at each step? What investigations could be designed to build the skills at each step?
Read more about using the LIA FrameworkRe-orient
Display the Melt or burn Resource sheet and ask students what they think about the two substances being displayed. Specifically discuss the burnt toast, and if it would be palatable to eat for most people and why they think that. Refer to any data from the previous lessons investigation that supports this.
- What foods are being displayed?
- What state are they in?
- How do we know if something has melted? What state is it in before it melts?
- Which item is burnt? How can you tell?
- Can the melting be reversed? How?
- Can the burning be reversed? Why not?
- What would happen to the toast if we put it back in the toaster again?
- Is it possible to make the melted chocolate burn?
- Yes, if the temperature were high enough, it would start to burn and form a new substance.
Pose the question: How does a candle burn?
The Inquire phase allows students to cycle progressively and with increasing complexity through the key science ideas related to the core concepts. Each Inquire cycle is divided into three teaching and learning routines that allow students to systematically build their knowledge and skills in science and incorporate this into their current understanding of the world.
When designing a teaching sequence, it is important to consider the knowledge and skills that students will need in the final Act phase. Consider what the students already know and identify the steps that need to be taken to reach the level required. How could you facilitate students’ understanding at each step? What investigations could be designed to build the skills at each step?
Read more about using the LIA FrameworkIdentifying and constructing questions is the creative driver of the inquiry process. It allows students to explore what they know and how they know it. During the Inquire phase of the LIA Framework, the Question routine allows for past activities to be reviewed and to set the scene for the investigation that students will undertake. The use of effective questioning techniques can influence students’ view and interpretation of upcoming content, open them to exploration and link to their current interests and science capital.
When designing a teaching sequence, it is important to spend some time considering the mindset of students at the start of each Inquire phase. What do you want students to be thinking about, what do they already know and what is the best way for them to approach the task? What might tap into their curiosity?
Read more about using the LIA FrameworkObservable change
Review ways of cooking food as previously discussed in Lesson 5.
Explain that today students are going to be investigating fire by observing burning candles. List different ways that fire is directly used to cook food, and the types of food cooked by fire.
Show students the intact candle, the melted candle and the candle stub. Discuss how all three candles were originally identical and record students’ ideas about how they got to their current state in the class science journal.
- What has happened to these candles? Why do you think that?
- Has it melted or burned?
- Why is there only a stub left? Where has the wax gone?
- What do I need to light the intact candle?
Pose the question: How does a candle burn?
The Inquire phase allows students to cycle progressively and with increasing complexity through the key science ideas related to the core concepts. Each Inquire cycle is divided into three teaching and learning routines that allow students to systematically build their knowledge and skills in science and incorporate this into their current understanding of the world.
When designing a teaching sequence, it is important to consider the knowledge and skills that students will need in the final Act phase. Consider what the students already know and identify the steps that need to be taken to reach the level required. How could you facilitate students’ understanding at each step? What investigations could be designed to build the skills at each step?
Read more about using the LIA FrameworkThe Investigate routine provides students with an opportunity to explore the key ideas of science, to plan and conduct an investigation, and to gather and record data. The investigations are designed to systematically develop content knowledge and skills through increasingly complex processes of structured inquiry, guided inquiry and open inquiry approaches. Students are encouraged to process data to identify trends and patterns and link them to the real-world context of the teaching sequence.
When designing a teaching sequence, consider the diagnostic assessment (Launch phase) that identified the alternative conceptions that students held. Are there activities that challenge these ideas and provide openings for discussion? What content knowledge and skills do students need to be able to complete the final (Act phase) task? How could you systematically build these through the investigation routines? Are there opportunities to build students’ understanding and skills in the science inquiry processes through the successive investigations?
Read more about using the LIA FrameworkFollowing an investigation, the Integrate routine provides time and space for data to be evaluated and insights to be synthesized. It reveals new insights, consolidates and refines representations, generalises context and broadens students’ perspectives. It allows student thinking to become visible and opens formative feedback opportunities. It may also lead to further questions being asked, allowing the Inquire phase to start again.
When designing a teaching sequence, consider the diagnostic assessment that was undertaken during the Launch phase. Consider if alternative conceptions could be used as a jumping off point to discussions. How could students represent their learning in a way that would support formative feedback opportunities? Could small summative assessment occur at different stages in the teaching sequence?
Read more about using the LIA FrameworkHow does a candle burn?
Students investigate how candles burn through observation.
Discuss why this investigation is being done as an observation and the safety factors that need to be considered to ensure safety when investigating fire, focusing specifically on the danger of serious burn injuries and fire getting out of control.
Create a list of questions in the class science journal for students to consider as they observe the candle burning, such as:
- What do you need for a candle to burn?
- What happens to the size of the candle when it burns?
- What happens to the wax when the candle is burning?
Light an intact candle and ask students to carefully observe the candle burning and discuss possible answers to the questions.
Show students the separate components of an intact candle and its components, the wick and the wax, and ask them to predict what they expect will happen if they were lit separately.
Demonstrate what happens to each component when you attempt to light it and compare it to students' predictions.
Next, show the students a jar or bowl and ask them if they identify it as empty, and why they think that. Based on their learning in Year 5, students should be able to identify that the jar/bowl is 'full' of air.
Ask students to predict what they think will happen if the jar/bowl was inverted and it was placed over a lit candle.
Demonstrate what happens when the jar is placed over the lit intact candle, and compare it to students’ predictions.
Safety note: Non-tempered glass can potentially crack from the heat generated by the candle. The glass will also be hot afterwards. Take care to ensure students stand well back from the demonstration area or wear protective eyewear. Do not touch the glass or allow students to touch it directly after the candle extinguishes.
Discuss what happened in these demonstrations and the scientific claims that might be made as a result.
- Did the wick light, and did it continue to burn? What does this tell us?
- Did the wax light, and did it continue to burn? What does this tell us?
- Did the lit candle continue to burn under the jar? How long did it burn for?
- Why do you think the candle went out when we covered it with the jar?
- What claim might we make about what a fire needs to burn?
- Students may not be able to answer this question yet. It will be returned to in the Integrate step following further investigation.
Fire (combustion)
Fire is what we see in the chemical reaction of combustion.
Fire is what we see in the chemical reaction of combustion. This reaction requires three things: heat, fuel, and oxygen. ‘Getting the fire started’ literally means providing enough heat to start the combustion reaction. With candles, this initial heat melts the wax so it can be drawn up the wick. The wax then vaporises (becomes a gas) and forms the fuel of the combustion reaction.
The fuel provides the chemical energy for the reaction. It is generally carbon-based, such as wood, coal, natural gas, oil, or wax. Once started, the reaction transforms the chemical energy in the vaporised wax into heat energy, which then allows the combustion reaction to continue.
Oxygen (from the air) reacts with the vaporised wax fuel in the heat. Combustion reactions usually produce carbon dioxide gas and water vapour, for example:
$$\text{candle wax} + \text{oxygen} \rightarrow \text{carbon dioxide} + \text{water}$$
In the chemical reaction, the hydrogen and carbon molecules making up the wax separate. The carbon joins with some of the oxygen to form carbon dioxide, and the hydrogen joins with some of the oxygen to make water. Both of these substances are gases which makes them difficult to see. Occasionally, water droplets form on the inside of a jar placed over a lit candle.
Smothering fire
Fire blankets are designed to stop oxygen from reaching the fuel and, therefore, stop the combustion reaction. A candle goes out when covered by a jar because the oxygen in the jar is converted to carbon dioxide and water. The flame becomes surrounded by carbon dioxide gas, which stops the combustion reaction.
Ignition point
When a fuel receives enough heat and oxygen, it will burst into flame. The temperature at which this occurs is known as the ignition point, and each fuel has its own ignition point. Substances with low ignition points are more likely to burn when heated by a fire and are known as flammable, such as, certain fabrics and paper. Fire starters have a low ignition point; they are therefore easy to light, and the heat produced by their burning can cause logs to ignite.
If the temperature drops below the ignition point, the combustion reaction stops. Firefighters douse flames with water because the water absorbs the heat energy to change the liquid water into water vapour, dropping the temperature of the fire. For the same reason, logs that are full of moisture will not burn easily since the initial ignition heat will be absorbed by the water, turning the liquid water into water vapour.
Students’ alternative conceptions
What alternative conceptions might students hold about fire and how it burns?
Students might not think that gaseous substances, for example, oxygen, are actively involved in the burning process. Therefore, they might not realise that such substances are changed during the reaction. Many students think that during burning, a substance called heat is formed, and no other substances are formed. Heat is not a substance—it is a form of energy. The two new substances formed (carbon dioxide and water) are both colourless gases. Students might believe that the wax slows the wick down or holds it up, rather than realising its role as a fuel. Similarly, students might believe that a candle simply melts or changes to vapour in the air, rather than being chemically altered and producing new substances.
Students might not think that gaseous substances, for example, oxygen, are actively involved in the burning process. Therefore, they might not realise that such substances are changed during the reaction. Many students think that during burning, a substance called heat is formed, and no other substances are formed. Heat is not a substance—it is a form of energy. The two new substances formed (carbon dioxide and water) are both colourless gases. Students might believe that the wax slows the wick down or holds it up, rather than realising its role as a fuel. Similarly, students might believe that a candle simply melts or changes to vapour in the air, rather than being chemically altered and producing new substances.
The Inquire phase allows students to cycle progressively and with increasing complexity through the key science ideas related to the core concepts. Each Inquire cycle is divided into three teaching and learning routines that allow students to systematically build their knowledge and skills in science and incorporate this into their current understanding of the world.
When designing a teaching sequence, it is important to consider the knowledge and skills that students will need in the final Act phase. Consider what the students already know and identify the steps that need to be taken to reach the level required. How could you facilitate students’ understanding at each step? What investigations could be designed to build the skills at each step?
Read more about using the LIA FrameworkIdentifying and constructing questions is the creative driver of the inquiry process. It allows students to explore what they know and how they know it. During the Inquire phase of the LIA Framework, the Question routine allows for past activities to be reviewed and to set the scene for the investigation that students will undertake. The use of effective questioning techniques can influence students’ view and interpretation of upcoming content, open them to exploration and link to their current interests and science capital.
When designing a teaching sequence, it is important to spend some time considering the mindset of students at the start of each Inquire phase. What do you want students to be thinking about, what do they already know and what is the best way for them to approach the task? What might tap into their curiosity?
Read more about using the LIA FrameworkThe Investigate routine provides students with an opportunity to explore the key ideas of science, to plan and conduct an investigation, and to gather and record data. The investigations are designed to systematically develop content knowledge and skills through increasingly complex processes of structured inquiry, guided inquiry and open inquiry approaches. Students are encouraged to process data to identify trends and patterns and link them to the real-world context of the teaching sequence.
When designing a teaching sequence, consider the diagnostic assessment (Launch phase) that identified the alternative conceptions that students held. Are there activities that challenge these ideas and provide openings for discussion? What content knowledge and skills do students need to be able to complete the final (Act phase) task? How could you systematically build these through the investigation routines? Are there opportunities to build students’ understanding and skills in the science inquiry processes through the successive investigations?
Read more about using the LIA FrameworkStaying lit
Pose the question: What things will affect the time a candle stays alight under a jar/bowl?
Record variables using the Variables grid Resource sheet, marking the variable to be measured (the time the candle stays alight) in the centre of the grid with a M and other variables around it, for example the size of the jar, the size of the candle, the wax of the candle, the air around the candle etc. Add or remove columns/row as required.
Identify the variable to be changed (the size of the jar or bowl) and use this to write a clear question for investigation: “What happens to the time a candle is able to stay alight when we change the size of the jar/bowl it’s underneath?”
If students are experienced using a variables grid, you could allow them to attempt this part of the investigation on their own.
Optional: Discuss how to:
- make it a fair test by only changing one variable and keeping all others the same.
- measure how much air is contained in each jar, for example, by measuring the amount of water each jar holds with a measuring jug or with digital scales (1 cm3 of water = 1 mg).
- assist students to measure the volume of each jar, then ensure the jars are wiped clean and dry.
Students complete the P and R sections of a Predict, Reason, Observe, Explain (PROE) chart to record their predictions about how long they think the candles will stay alight underneath the different-sized jars and why they think that. This can be done directly into their individual science journals or you can use the template provided on the PROE Resource sheet.
Students observe a teacher-led investigation, using a timer/s to collect data on how long it takes a candle to extinguish underneath each different sized jar. Time and record data as a class, before allowing students an opportunity to note their own observations on their PROE chart. Conduct each candle-burning test separately, and try to ensure the timer is started at the exact moment the jar creates a seal with the tabletop.
Allow students to observe the jars without touching them, after each test, noting any observations of the glass, such as water droplets—this will be discussed later.
Optional: Conduct replication trials and calculate the average time it takes for the candle to go out. Discuss why conducting replication trials helps provide more reliable results. Note for teachers: The jars need to be flushed by scooping/swooshing them through the air after each trial, to remove the carbon dioxide. This will be discussed with students during the Integrate routine, so there is no need to discuss it now beyond making sure students notice that you are doing so.
As a class, represent the data collected using a line graph using the A3 line graph template Resource sheet.
Discuss the purpose and features of a line graph.
Optional: Student can make their own graph using the A4 line graph template Resource sheet.
Ask students to use the graph to predict how long a candle will burn under a jar larger than the ones used.
Note: In order to use the graph to make this prediction, the intervals on the axes need to be equal (see the sample graph). It is best to have at least three experimental data points to make a more accurate prediction. This allows the scientist to check that all three data points form a straight line.
The Inquire phase allows students to cycle progressively and with increasing complexity through the key science ideas related to the core concepts. Each Inquire cycle is divided into three teaching and learning routines that allow students to systematically build their knowledge and skills in science and incorporate this into their current understanding of the world.
When designing a teaching sequence, it is important to consider the knowledge and skills that students will need in the final Act phase. Consider what the students already know and identify the steps that need to be taken to reach the level required. How could you facilitate students’ understanding at each step? What investigations could be designed to build the skills at each step?
Read more about using the LIA FrameworkFollowing an investigation, the Integrate routine provides time and space for data to be evaluated and insights to be synthesized. It reveals new insights, consolidates and refines representations, generalises context and broadens students’ perspectives. It allows student thinking to become visible and opens formative feedback opportunities. It may also lead to further questions being asked, allowing the Inquire phase to start again.
When designing a teaching sequence, consider the diagnostic assessment that was undertaken during the Launch phase. Consider if alternative conceptions could be used as a jumping off point to discussions. How could students represent their learning in a way that would support formative feedback opportunities? Could small summative assessment occur at different stages in the teaching sequence?
Read more about using the LIA FrameworkJar size impact
Ask students to discuss the findings with a partner then share their thoughts with the class.
In reference to the earlier discussion about what is inside the jar, support students to recognise that the jar isn’t ‘empty’ but is full of air: containing a variety of gases, including nitrogen, oxygen, carbon dioxide, and hydrogen, among others.
Discuss why the candle goes out under the jar, and why the candle stays lit for longer when the jar is bigger.
- Why do you think the candle stayed lit for longer under the larger jar?
- Tell me more about the word ‘air’. What is air made up of?
- Scientists say that fires use oxygen in the air as fuel. How does that fit with your idea?
- What is oxygen?
- Where is oxygen found?
- Why did the candle under the jar eventually burn out?
- Most of the oxygen in the jar had been used up, so the fire couldn't burn anymore.
- What do you think the oxygen had turned into?
- The oxygen turns into carbon dioxide as it ‘burns’.
- (If you ran replication trials) Why did I ‘swish’ the jars through the air earlier to clean them out in between each use?
- So that the carbon dioxide could come out of the jar, and be replaced by air with more oxygen in it.
- Note that air also contains small amounts of carbon dioxide.
- Do you think that fire is a reversible or irreversible change?
Pose the question: Where does the wax go when a candle burns?
Discuss how the candle becomes smaller when lit. If students seem unsure, demonstrate by lighting another candle before discussing further. Birthday candles are a good choice for this demonstration as they burn quickly and will noticeably reduce in height.
Discuss how the initial heat melts and evaporates the wax into a gas (reversible/physical change). This wax gas combines with oxygen in the air and becomes carbon dioxide and water (irreversible/chemical change).
- When we observed the actual jars, what did we see?
- Why did the water droplets form on the inside of the jar?
- I wonder what would happen if the wax did not melt and flow up the wick?
Introduce students to the ‘fire triangle’ using the Fire triangle Resource sheet. Discuss the different types of cooking fires that students may have identified at the beginning of the lesson. Identify the elements required to start these types of fires and keep them burning.
Discuss how these fires can be extinguished by waiting until all the fuel has been burned, or smothered to prevent oxygen/air from reaching the fuel.
Finally, discuss the impact that cooking food, enabled by humans’ use and control over fire, has had on human survival. Some resources to support this are listed below. Select resources that are appropriate for your students and context, or add your own.
- The Origins of Cooking: How Food Shaped Human History (13:35)
- Note: Please be advised that this video intended for instructional use contains a brief image of a female breast (blurred at approximately 1:30 and in side profile at approximately 6:35 minutes), and we recommend previewing the material in advance to determine its appropriateness for your students and to follow any necessary school policies regarding parental notification or alternative assignments.
- Fire and the Brain: How Cooking Shaped Humans, Article by American Museum of Natural History
- Cooking by Britannica Kids
- Every human culture includes cooking – this is how it began, Article in New Scientist
Reflect on the lesson
You might:
- add to the class word wall any vocabulary related to burning (combustion) as an irreversible change, such as carbon dioxide and energy (as heat and light).
- add to the class TWLH chart.
- discuss students’ own culturally important food and cooking experiences.
Line graphs
What is a line graph and when are they used?
Line graphs are ideal for visualising data that changes over time and for showing trends and patterns. In this case, the relationship between the size of a container and the time the candle stays alight.
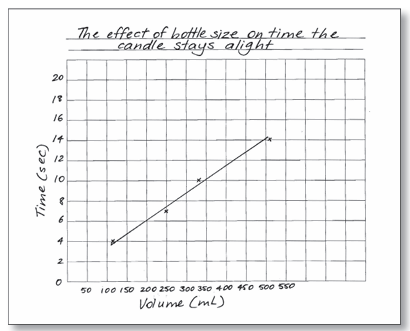
The horizontal axis (x-axis) identifies the variable that has been changed (jar volume), and the vertical axis (y-axis) is labelled with the variable that has been measured or observed (time in seconds).
To construct the candle burning line graph:
- Label the x-axis ‘Volume (ml)’ by placing the numbers on the lines (not the spaces).
- Label the y-axis ‘Time (sec)’ by placing the numbers on the lines.
- Determine a scale for the data. In the above example, beginning at zero, the volume increases in 50 ml increments, and the time scale increases in 2-second increments.
- Plot the data points on the graph.
- Draw a ‘line of best fit’ to represent the data trend. Do not extend the line beyond the plotted points.
- Title the graph ‘The effect of bottle size on the time the candle stays alight’, or similar.
As an alternative to graphing paper, these resources are available as a template for plotting the line graph:
- A3 Line Graph Template Resource Sheet
- A4 Line Graph Template Resource Sheet
Line graphs are ideal for visualising data that changes over time and for showing trends and patterns. In this case, the relationship between the size of a container and the time the candle stays alight.
The horizontal axis (x-axis) identifies the variable that has been changed (jar volume), and the vertical axis (y-axis) is labelled with the variable that has been measured or observed (time in seconds).
To construct the candle burning line graph:
- Label the x-axis ‘Volume (ml)’ by placing the numbers on the lines (not the spaces).
- Label the y-axis ‘Time (sec)’ by placing the numbers on the lines.
- Determine a scale for the data. In the above example, beginning at zero, the volume increases in 50 ml increments, and the time scale increases in 2-second increments.
- Plot the data points on the graph.
- Draw a ‘line of best fit’ to represent the data trend. Do not extend the line beyond the plotted points.
- Title the graph ‘The effect of bottle size on the time the candle stays alight’, or similar.
As an alternative to graphing paper, these resources are available as a template for plotting the line graph:
- A3 Line Graph Template Resource Sheet
- A4 Line Graph Template Resource Sheet